Netflix Stock Down 10%: Is a Deeper Correction Ahead?

Quick overview
- Netflix (NFLX) stock has surged over 724% in the past three years, indicating strong investor confidence.
- Current technical indicators suggest the stock may be nearing a correction phase, with signs of weakening bullish momentum.
- Bearish divergence is emerging on both weekly and daily charts, signaling potential downside pressure.
- Key support levels to watch include $890, $575, and the 200-day EMA near $1,010, which could influence future price movements.
The Netflix (NFLX) stock has delivered a remarkable rally of over 724% over the past three years, reflecting exceptional bullish momentum and strong investor conviction. However, current price action suggests the stock may be approaching a potential inflection point, with technical indicators signaling a possible correction phase ahead.
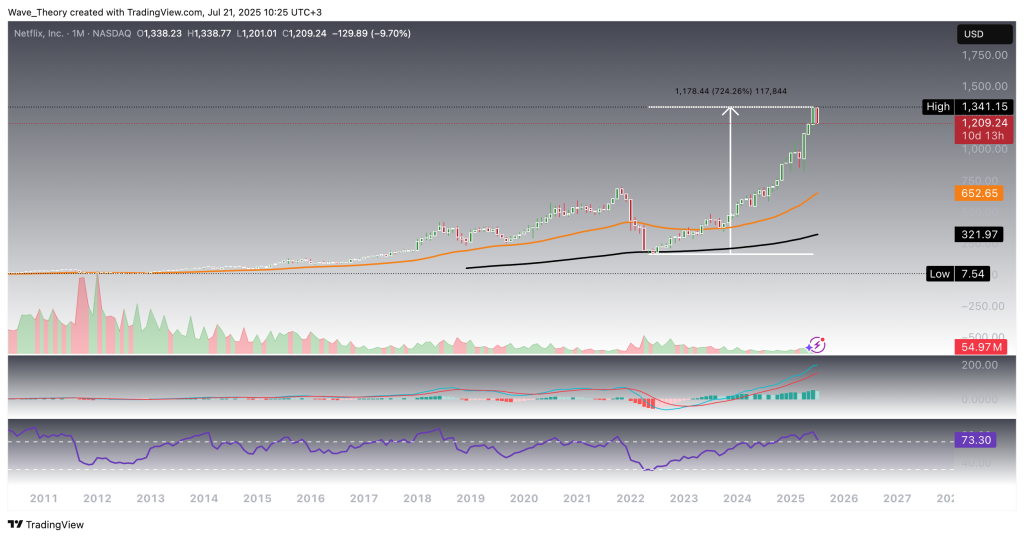
Netflix Stock Soared By 724.26 %
Netflix (NFLX) has surged over 724% in the past three years, following a decisive bounce off its 200-month EMA — a textbook confirmation of long-term support. The exponential moving averages (EMAs) and MACD lines remain bullishly crossed, reinforcing the prevailing long-term uptrend. However, momentum dynamics are beginning to show signs of exhaustion: the MACD histogram is ticking lower on the monthly chart, signaling weakening bullish momentum, while the RSI is entering deeply overbought territory — a zone that precedes corrective pullbacks. These developments warrant close monitoring, as they may mark the early stages of a broader consolidation or corrective phase.
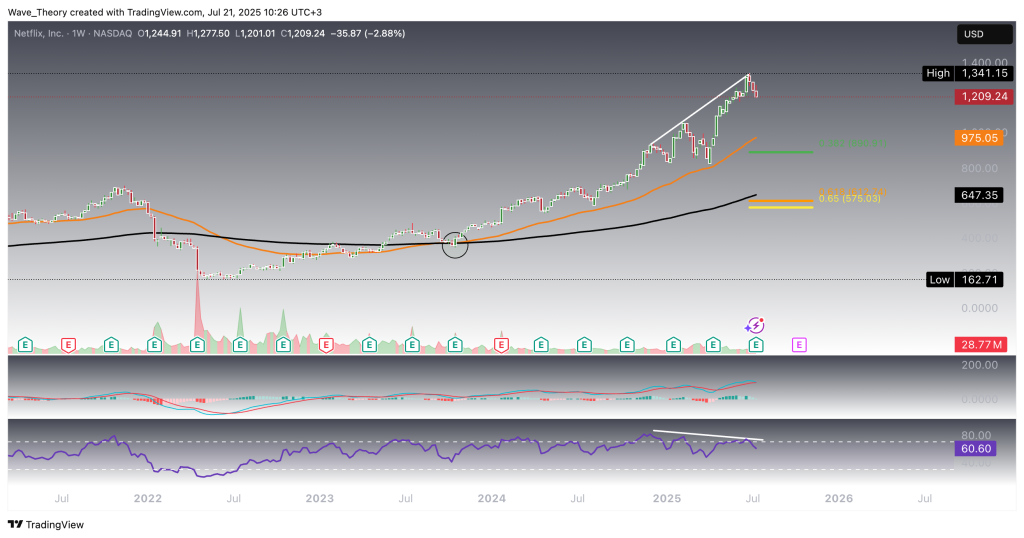
Bearish Divergence Emerging on the Weekly Chart
On the weekly timeframe, Netflix (NFLX) presents a mixed technical picture, with both bullish and bearish signals in play. On the bullish side, the exponential moving averages (EMAs) have completed a golden crossover, confirming mid-term trend strength, while the MACD lines remain bullishly crossed — both indicative of ongoing upward momentum.
However, the short-term outlook is increasingly tilted to the downside. The MACD histogram has begun to tick lower as of last week, suggesting a loss of bullish momentum, and more critically, the RSI is flashing a significant bearish divergence — a historically reliable precursor to corrective moves.
Given these developments, a corrective phase appears increasingly likely, with key Fibonacci support levels to watch at $890 and $575. Additionally, the 50-week EMA at $975 and the 200-week EMA at $647 serve as important dynamic support zones that could offer a potential bounce or trend resumption.
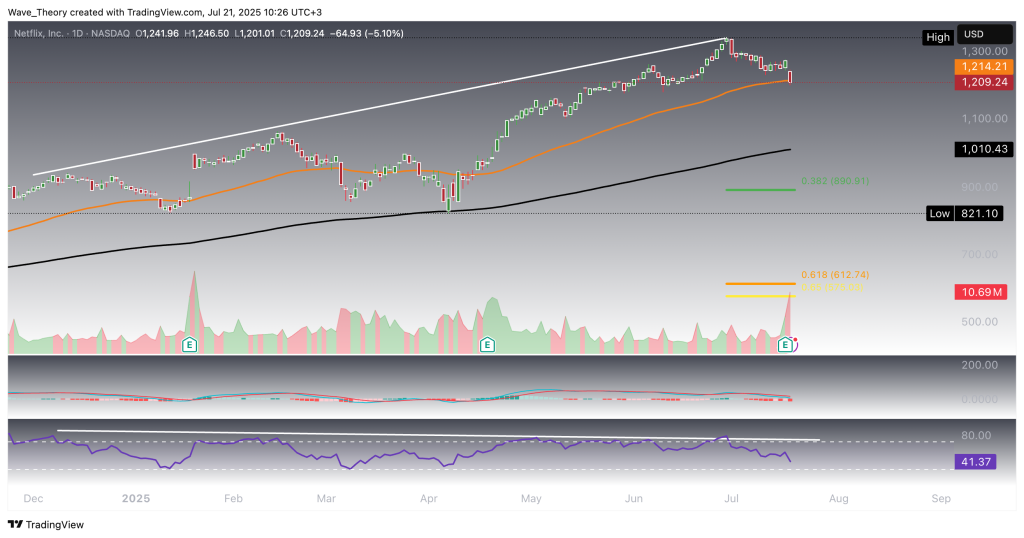
Similar Outlook On The Daily Chart
The daily chart mirrors the broader weakness seen on the weekly timeframe. While the exponential moving averages (EMAs) remain in a golden crossover formation — affirming the bullish trend in the short- to medium-term — momentum indicators are turning increasingly bearish. The MACD lines have crossed bearishly, the histogram continues to trend lower, and the RSI is flashing a pronounced bearish divergence, all signaling growing downside pressure.
Netflix (NFLX) has already pulled back from its recent high of $1,341 to $1,201, where it is currently testing support at the 50-day EMA. Should this level fail to hold, the correction may extend toward the 200-day EMA near $1,010, which serves as the next significant support zone.
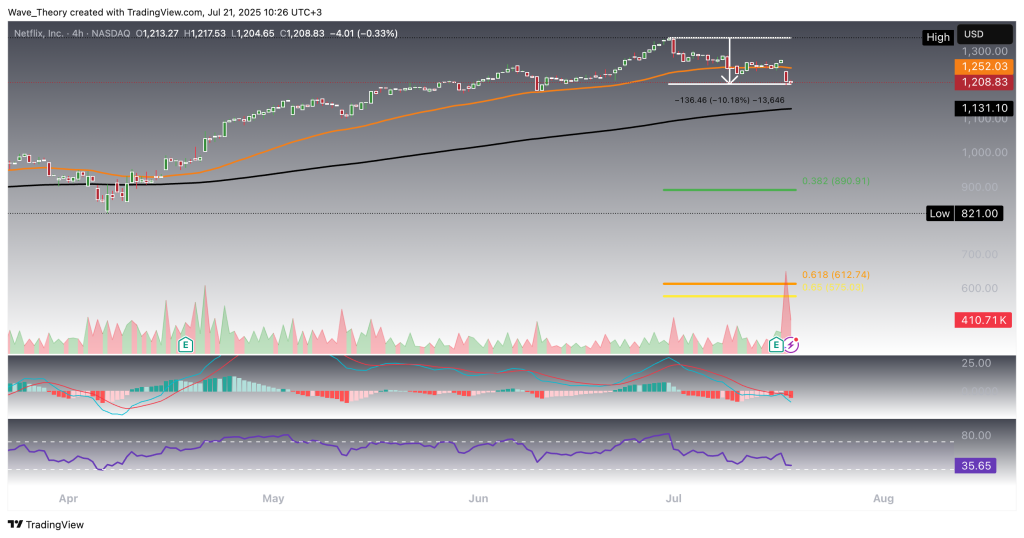
Netflix Stock Down 10% — More Downside Possible
Netflix (NFLX) has already declined by approximately 10.2%, and further downside pressure remains a distinct possibility. On the 4-hour chart, momentum indicators lean bearish: the MACD lines are bearishly crossed, and the MACD histogram continues to trend lower, signaling persistent short-term weakness. The RSI is currently trading in neutral territory, offering no immediate reversal signal.
Despite this, the EMAs remain in a bullish golden crossover, indicating that the broader short-term trend remains intact. However, unless key support levels hold, the near-term structure favors continued weakness before any meaningful bounce can occur.
- Check out our free forex signals
- Follow the top economic events on FX Leaders economic calendar
- Trade better, discover more Forex Trading Strategies
- Open a FREE Trading Account
- Read our latest reviews on: Avatrade, Exness, HFM and XM
Related Articles


Sidebar rates
Related Posts
