btc-usd
Forex Signals Brief July 23: USD Slumps on Trade Uncertainty as S&P 500 Hits New High
Investors are on edge as the August 1 deadline for new U.S. trade treaties looms, pressuring the dollar and rippling through asset markets..
•
Last updated: Tuesday, July 22, 2025

Quick overview
- Investors are anxious as the August 1 deadline for new U.S. trade treaties approaches, causing the dollar to weaken by approximately 10% year-to-date.
- Despite the dollar's decline benefiting some multinational corporations, overall investor sentiment remains cautious towards buying the currency.
- Commodities and cryptocurrencies have surged due to the dollar's retreat, with gold rebounding significantly amid geopolitical tensions.
- Bitcoin and Ethereum have shown resilience, with Bitcoin finding support above $120,000 and Ethereum gaining 20% since April, driven by optimism for upcoming upgrades.
Live BTC/USD Chart
BTC/USD

0.0000
MARKETS TREND
Investors are on edge as the August 1 deadline for new U.S. trade treaties looms, pressuring the dollar and rippling through asset markets worldwide.
Dollar Slips Amid Trade Treaty Concerns and Fed Speculation
With the August 1 deadline for new U.S. trade treaties fast approaching, investor nerves are rising over the possibility of failed negotiations triggering fresh tariffs. The uncertainty has led to a weakening of the U.S. dollar, which is down roughly 10% year-to-date. This decline has actually benefited some American multinational corporations, bolstering overseas profits for companies like PepsiCo, Netflix, and 3M. Yet, despite these corporate gains, broader investor sentiment has not shifted toward buying the greenback.
Federal Reserve Chair Jerome Powell is also under increasing political pressure, further clouding the outlook. Expectations of future rate cuts have added to the dollar’s woes, diminishing its appeal and helping to push U.S. yields lower.
Commodities and Crypto Surge as Dollar Retreats
The weakening dollar gave a boost to commodities and cryptocurrencies. September crude oil fell by $0.56 to $65.39, reflecting mixed sentiment in the energy space.
Stocks Mixed as Nasdaq Stumbles, but Dow and S&P Stay Strong
The S&P 500 finished at a new record high, gaining 4.02 points (0.06%) to close at 6309.62. The Dow Jones Industrial Average rose a healthy 179.37 points (0.40%) to end the session at 44,502.44. The Nasdaq Composite, however, fell 81.49 points (-0.39%) to 20,892.69, dragged lower by tech-sector weakness.
Despite the Nasdaq’s decline, it ended the day well above its session lows after holding key technical support near the 50-hour moving average. The S&P’s ability to rally to a new high—despite cautious trading—reflects ongoing rotation into non-tech sectors and the market’s resilience in the face of global uncertainty.
Last week, markets were slower than what we’ve seen in recent months, with gold retreating and then bouncing to finish the week unchanged. EUR/USD slipped toward 1.16, while S&P and Nasdaq continued higher. The moves weren’t too big though, and we opened 35 trading signals in total, finishing the week with 23 winning signals and 12 losing ones.
Gold Rebounds, Climbs Above $3,400
Gold rallied strongly, rising by $33.98 to settle at $3,430.85. That move was driven by ongoing geopolitical tensions and the dollar’s decline. While the precious metal has rebounded from its 20-week moving average near $3,150, it remains in a consolidation phase after peaking near $3,500 earlier this year. Tepid demand suggests traders are still waiting for a stronger signal—whether from the Fed or inflation data—before taking new positions.
USD/JPY Returns Below the 100 Weekly SMA After Japanese Elections
Despite the yen’s overall strength, the USD/JPY pair spiked above 148, climbing beyond the 100-week SMA—a crucial long-term resistance level. The move was driven in part by Japanese capital flowing into overseas assets, adding complexity to monetary policy expectations. A sustained break above this level could reshape investor positioning and reignite debate over US and Japanese central bank divergence.
USD/JPY – Weekly Chart
Cryptocurrency Update
Bitcoin Rebounds off the 20 Daily SMA
Bitcoin briefly breached the $113,000 mark before retreating and finding support again above $120,000, underscoring the growing appetite for digital assets amid traditional market uncertainty. After dipping below its 50-day moving average earlier in the week, strong buying support around the 20-daily SMA helped fuel a swift recovery yesterday.
BTC/USD – Weekly chart
Ethereum Breaks Above Resistance, Heads for $4,000
Ethereum, meanwhile, has outshone Bitcoin with a 20% gain since April, breaking above its 100-week moving average. Optimism surrounding the upcoming Pectra upgrade, which aims to improve scalability and efficiency, has fueled a surge in institutional interest, with traders now eyeing a potential run toward the $4,000 zone.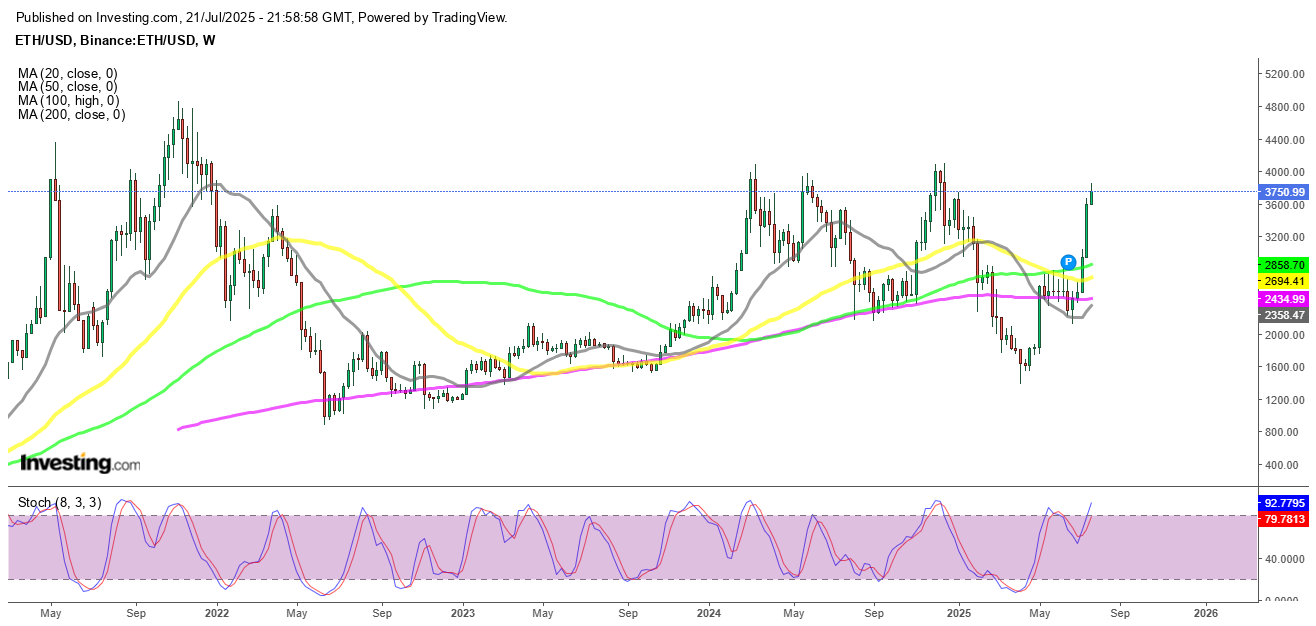
ETH/USD – Daily Chart
- Check out our free forex signals
- Follow the top economic events on FX Leaders economic calendar
- Trade better, discover more Forex Trading Strategies
- Open a FREE Trading Account
- Read our latest reviews on: Avatrade, Exness, HFM and XM
ABOUT THE AUTHOR
See More
Skerdian Meta
Lead Analyst
Skerdian Meta Lead Analyst.
Skerdian is a professional Forex trader and a market analyst. He has been actively engaged in market analysis for the past 11 years. Before becoming our head analyst, Skerdian served as a trader and market analyst in Saxo Bank's local branch, Aksioner. Skerdian specialized in experimenting with developing models and hands-on trading. Skerdian has a masters degree in finance and investment.
Related Articles


Sidebar rates
Related Posts
