Daily Crypto Signals: Ethereum Surges, XRP Eyes Rebound, and Solana Shows Resilience
Ethereum emerged as last week's top performer with a 27% surge in its BTC ratio amid new US crypto legislation, while XRP faces potential
Quick overview
- Ethereum surged 27% in its BTC ratio last week, becoming the top performer amid new US crypto legislation.
- Institutional adoption is accelerating, with significant investments in Ethereum and the approval of Bitwise's crypto index fund conversion to an ETF.
- XRP faces potential correction to $3 support levels after hitting a multi-year high, while Solana experienced a 9.5% drop following a liquidation of long positions.
- The upcoming launch of Ether staking ETFs could attract an additional $20 to $30 billion annually, solidifying Ethereum's role in traditional finance.
Ethereum ETH/USD emerged as last week’s top performer with a 27% surge in its BTC ratio amid new US crypto legislation, while XRP XRP/USD faces potential correction to $3 support levels as institutional adoption accelerates across the broader cryptocurrency market.
Crypto Market Developments
This week, the cryptocurrency industry saw a lot of changes in the institutional world. For example, Block officially joined the S&P 500, which gave the benchmark equity index more exposure to Bitcoin. Jack Dorsey’s tech company has 8,584 Bitcoin, which is worth almost $1 billion. This makes it the 13th largest corporation holder of BTC. After the S&P 500 announcement, the company’s NYSE shares went up almost 14% in five days.
At the same time, big Wall Street firms Goldman Sachs and BNY Mellon said they would let institutional clients use tokenized money market funds on Goldman’s private blockchain. This project has big names in the industry like BlackRock, Fidelity Investments, and Federated Hermes on board. It promises real-time settlement and access to the market 24 hours a day, seven days a week. The new law, the GENIUS Act, set out rules for stablecoins in the US. This is what led to the development.
The SEC approved Bitwise’s crypto index fund conversion to an ETF, but then immediately put the process on hold. This is a “bizarre situation” that is comparable to prior Grayscale delays. The fund gives investors access to a group of cryptocurrencies, such as Bitcoin and Ether. Some analysts think the SEC is taking its time because it wants to set listing rules for crypto ETFs.
Ethereum (ETH) Performance and Outlook
Last week, Ethereum was the best-performing cryptocurrency on the market. Bitwise analysts called it a “watershed moment” because of new US crypto rules and institutional rotation. ETH did the best, with its BTC ratio going up 27%, which caused Bitcoin’s dominance to drop 6% and showed that money was moving to altcoins. The surge supports Bitwise’s argument that the gap in value between ETH and BTC is getting smaller. This is helped by good news in the economy, such as the Senate’s bipartisan adoption of the Genius Act and the House’s passage of the Clarity Act.
The Ethereum network is in a unique position to profit from clear rules because it holds 50% of the stablecoin market cap, which hit $140 billion on Tuesday, and 55% of the value of tokenized assets. Legislative changes are likely to lead to more capital formation and product innovation in Ethereum-native ecosystems. There was a lot of demand in the derivative markets, with open interest rising by $6 billion across the biggest exchanges. CME futures reached all-time highs, and Ether ETPs saw $2.1 billion in new money.
Bit Digital traded all of its Bitcoin holdings to buy over 100,000 ETH, which made it one of the largest institutional ETH investors. This sped up the adoption of cryptocurrencies by institutions. BTCS Inc. increased its ETH holdings to 29,122 ETH, a 221% rise since late 2024. BitMine Immersion Technologies also doubled its holdings to 163,000 ETH. More and more institutions are interested in ETH, and 51 organizations have said they own staked ETH worth 1.26% of Ether’s supply. This makes ETH a possible store of wealth like Bitcoin.
The launch of Ether staking ETFs, which is scheduled to happen by the third quarter of 2025, might bring in an extra $20 to $30 billion a year. Spot ETH ETFs have brought in $70 million a day over the past year. Adding a 3–4% staking income could make institutions more likely to use ETH and solidify its place in tokenization and the integration of traditional finance.
XRP Market Dynamics and Support Levels
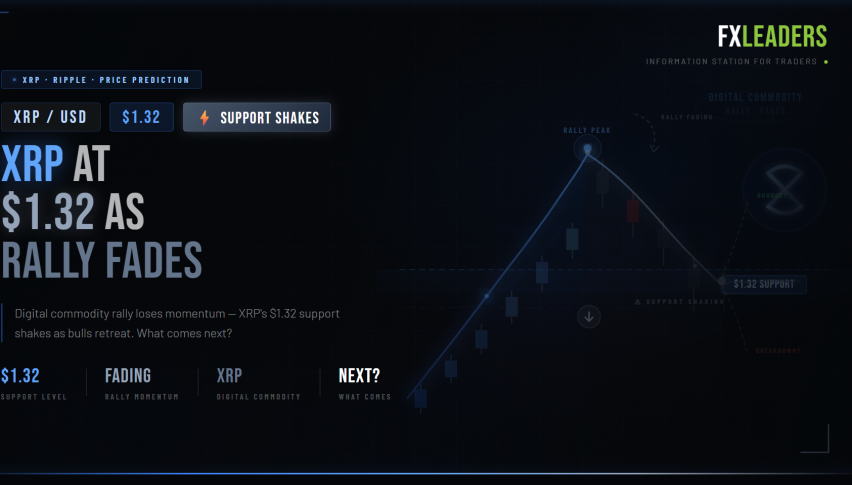
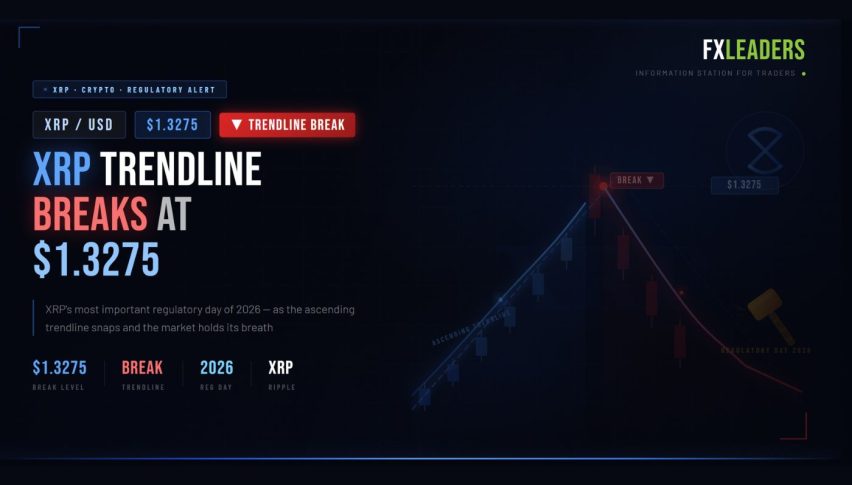
XRP hit a multi-year high of almost $3.66 on Friday, which helped its market cap surpass McDonald’s on Monday. However, it couldn’t keep up the momentum since short-term buyers took profits following the big rise. The price couldn’t break through the $3.66 resistance level, which caused it to drop below $3.40. Technical analysis suggests that the pair could drop below the 20-day exponential moving average at $2.99, which is a key support level for bulls.
If XRP finds support at the 20-day EMA and there is a lot of buying interest, bulls may try to drive the price back up to $3.66. If it breaks above there, it may go for $4 and then $4.86. If prices stay weak below the 20-day EMA, though, it could mean that the break above $3.40 was a bull trap, which would make the near-term positive outlook worthless and perhaps lead to worse declines.
The four-hour chart reveals that XRP fell below the $3.34 support level as bears try to make a comeback. The next support levels are at $3 and $2.80. If the price goes back up from these support zones and then breaks above the moving averages, it might mean that the corrective phase is coming to a close and the price could rise again toward $3.66. On the other hand, if recovery stops at the 20-day EMA, it means that the mood has changed from buying dips to selling rallies. This makes it more likely that prices will fall further to $2.60 and may even postpone the start of the uptrend.
Solana (SOL) Technical Analysis and Future Prospects
On Wednesday, Solana SOL/USD had a big loss of 9.5%, going from $205 to $186. This could have made a bearish engulfing pattern on the daily chart. The drop came after $30 million in long positions were liquidated when open interest reached an all-time high of $12 billion. This suggests that traders started to close down their positions and take their winnings, even though SOL was still 36% below its all-time peak.
Before the correction, a few on-chain signs showed that the market was about to go down. For example, the net taker volume turned sell-heavy and the aggregated spot cumulative volume delta dropped as holders took profits near $200. The aggregated futures CVD went down even though prices went up, which is a bearish divergence. At the same time, financing rates reached quarterly highs, which means there were too many long orders, which set up the right conditions for a long squeeze that forced traders with too much leverage to leave.
Even if the unexpected 9% decline raised short-term concerns, the pullback comes after a big 56% advance over 30 days and looks like a healthy reset after a lot of upward momentum. In terms of technical analysis, the daily chart is still positive, and $180 is a significant level of support for the bullish trend to continue. SOL confirmed a bullish break of structure by regaining $180. This was the first substantial bullish trend change since November 2024, and it caused a golden cross between the 50-day and 200-day EMAs.
The golden cross is a traditional sign that the market is going up. The last time SOL happened, it led to gains of more than 730% between October 2023 and March 2024. A good price reaction and support around $180 would add to the bullish momentum that might lead to new highs. But if this level isn’t defended, it might lead to a deeper drop toward the $168–$157 zone, which is in line with daily fair value gaps and 0.5–0.618 Fibonacci retracement levels that are seen as high-probability technical retest regions.
- Check out our free forex signals
- Follow the top economic events on FX Leaders economic calendar
- Trade better, discover more Forex Trading Strategies
- Open a FREE Trading Account
- Read our latest reviews on: Avatrade, Exness, HFM and XM
Related Articles
Sidebar rates
Related Posts
