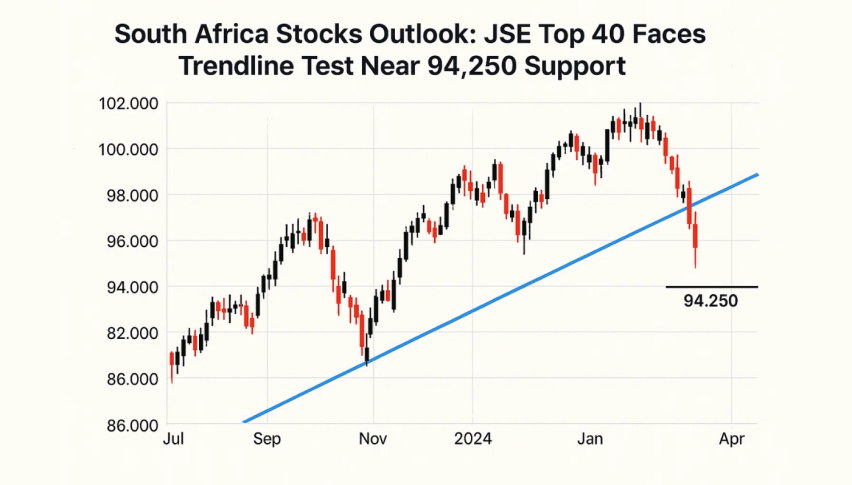
South Africa Stocks Outlook: JSE Top 40 Faces Trendline Test Near 94,250 Support
The JSE FTSE All Share Index rose 345.34 points (0.34%) on Monday to 103,068.84 ZAR. A small gain as the rand weakened...
Quick overview
- The JSE FTSE All Share Index rose by 345.34 points (0.34%) to 103,068.84 ZAR, aided by firmer commodity prices and positive investor sentiment from potential US rate cuts.
- The rand weakened after a strong rally as investors took profits, though it may find medium-term support from global monetary shifts.
- The JSE Top 40 Index faces resistance after a pullback, indicating caution as momentum indicators show fading strength.
- Local economic data will be crucial in determining the direction of SA equities, with strong numbers likely supporting the market.
The JSE FTSE All Share Index rose 345.34 points (0.34%) on Monday to 103,068.84 ZAR. A small gain as the rand weakened from its 9 month high.
The move was helped by firmer commodity prices, especially gold which is key to SA’s economy. Investor sentiment was also boosted by the US Fed’s signals of a possible rate cut in September. A dovish shift will weaken the dollar and keep capital flowing into emerging markets like SA.
Rand Weakens After Strong Rally
The rand, which rallied late last week, slipped on Monday as investors took profits. The currency was boosted by a softer dollar and a rebound in gold after Fed Chair Jerome Powell hinted at easing. Analysts expect the rand to be supported in the medium term by global monetary shifts but expect volatility as local data – business cycle indicators, producer inflation, credit trends and trade balances – is released this week.
Technical Analysis: JSE Top 40 Faces Resistance
The JSE Top 40 Index has pulled back from its recent high at 95,630 after forming a bearish rejection candle at 94,954. The long upper wick shows selling pressure at higher levels.
Momentum has cooled with the RSI easing to 54 from overbought and the MACD narrowing, both indicating fading strength. The index is still respecting higher lows since July supported by the 50 day EMA at 93,648 and the 0.786 Fibonacci at 92,038 which form a key demand zone.
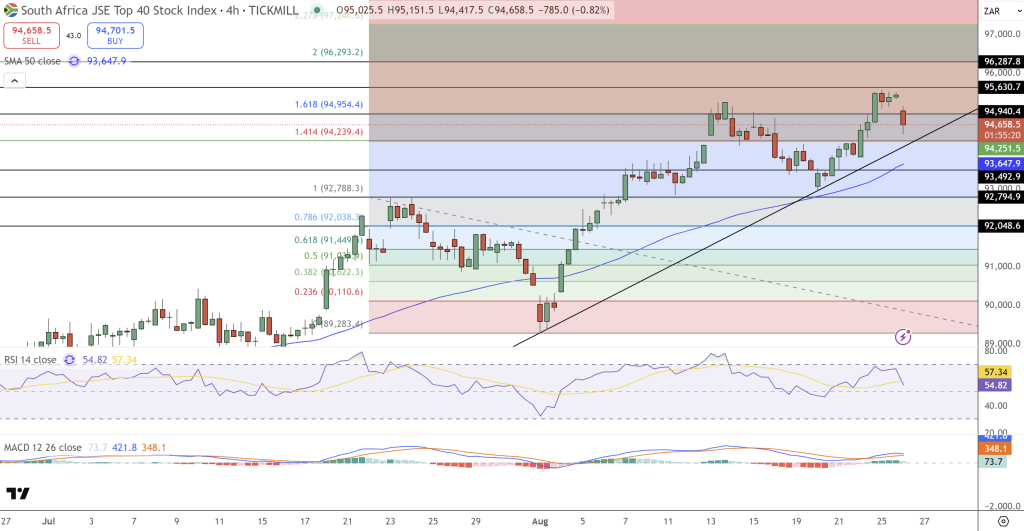
Trade Setup: A break below 94,250 could see a retest of 93,650-93,490 and potentially 92,800 if the trendline fails. A bullish engulfing candle above 94,250 could see momentum back to 95,630 with a test of 96,287.
Outlook for SA Equities
The All Share Index still reflects investor appetite driven by commodities and global easing bets. But the Top 40’s rejection at resistance levels suggests caution in the short term. Market watchers believe local data will be key: strong numbers will support equities and weak numbers will add to the downside.
- Check out our free forex signals
- Follow the top economic events on FX Leaders economic calendar
- Trade better, discover more Forex Trading Strategies
- Open a FREE Trading Account