WTI Oil Forecast: $64 Range Holds as Supply Risks Meet Market Tensions
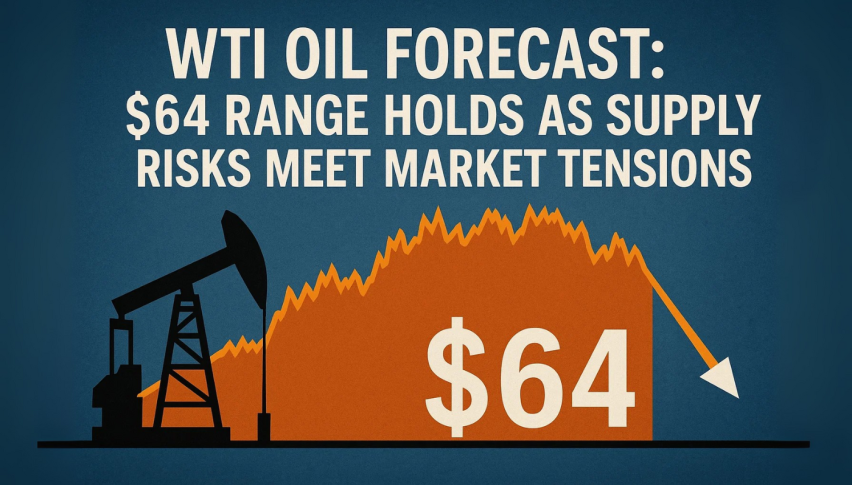
WTI crude is trading at $64 and heading for its first monthly decline in four months but still up for the second week in a row...
Quick overview
- WTI crude is currently trading at $64, facing its first monthly decline in four months despite being up for the second consecutive week.
- The International Energy Agency predicts that supply will exceed demand in the coming quarters, while OPEC+ is working to restore idled capacity.
- Geopolitical tensions and Russian export flow uncertainties are contributing to market volatility, with significant cuts expected in September shipments.
- Traders should watch key price levels, with a close above $65.12 indicating a potential upward trend and a close below $63.90 suggesting a deeper pullback.
WTI crude is trading at $64 and heading for its first monthly decline in four months but still up for the second week in a row. Market is mixed as geopolitical tensions and supply disruptions meet expectations of a global surplus.
The International Energy Agency says supply will outpace demand in coming quarters while OPEC+ is restoring idled capacity. Seasonal US demand is also slowing with the end of the summer driving season and capping upside.
Russian export flows are adding to the uncertainty. Shipments from Ust-Luga are expected to be cut in half in September and pipeline deliveries into Central Europe have resumed so traders are balancing supply risks and surplus concerns.
Oil prices dip amid demand concerns but are on track for a weekly gain. Watch for OPEC+ supply changes and geopolitical tensions impacting the market. #OilMarket #Brent #WTIhttps://t.co/8N72cV7ISh
— Global Banking & Finance Review (@GBAFReview) August 29, 2025
Energy Charts Tighten Up to a Pivot
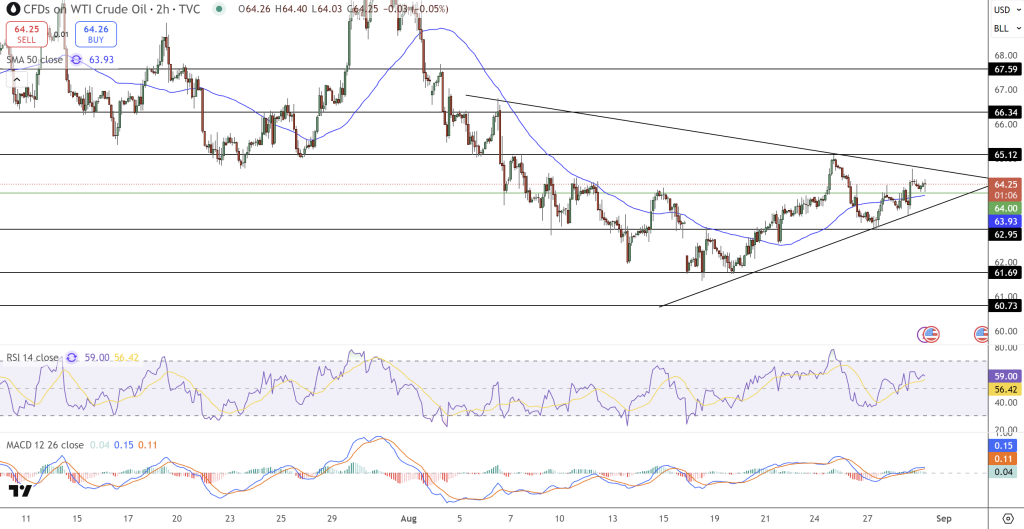
On the 2-hour chart, WTI crude is coiling in a symmetrical triangle. Price is testing resistance at $65.12 and supported by an ascending trendline from August lows.
Momentum is constructive. RSI is at 59 above the middle and buyers are in control. MACD has turned positive and the 50-period SMA at $63.93 is rising so the floor is in place.
Key levels to watch:
- Above $65.12 and it’s $66.34 and $67.59
- Below $63.90 and it’s $61.69 and $60.73
Crude Oil Trade Setups for Beginners
For traders, it’s simple. A close above $65.12 on strong volume confirms the trend and you can go long with targets in $66.34–67.59. Stop below $63.90 to manage risk.
If it fails to hold support, sellers may come back in and we could see a deeper pullback to $61.69.
- Check out our free forex signals
- Follow the top economic events on FX Leaders economic calendar
- Trade better, discover more Forex Trading Strategies
- Open a FREE Trading Account
