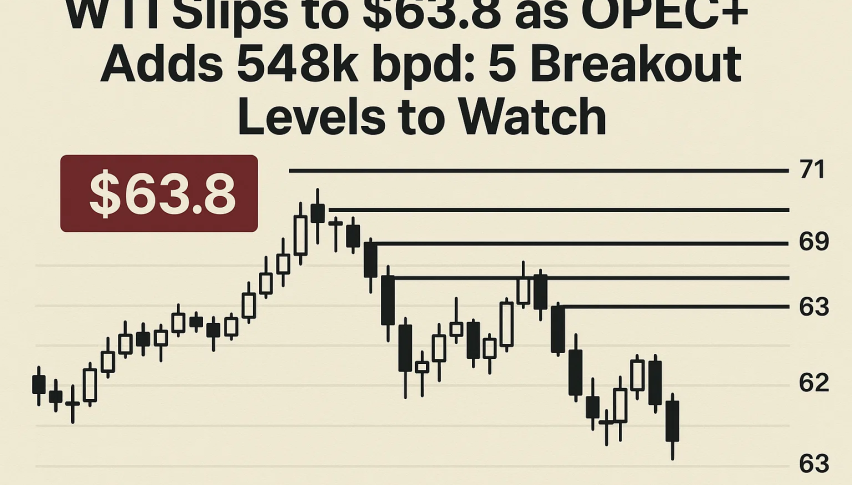
WTI Slips to $63.8 as OPEC+ Adds 548k bpd: 5 Breakout Levels to Watch
WTI fell to $63.8 on Monday as markets await more OPEC+ supply. The group just added 548,000 b/d to the global oversupply picture...
Quick overview
- WTI crude oil prices fell to $63.8 as OPEC+ added 548,000 b/d to global oversupply and US production reached a record 13.58 million b/d.
- Demand is declining with the end of the US summer driving season, leading to reduced gasoline consumption and less incentive for refiners to draw down crude.
- WTI is forming a contracting triangle pattern, indicating a potential breakout, with key levels for traders to watch at $64.75 for bullish and $63.67 for bearish triggers.
- Market momentum is neutral, and traders are advised to remain patient until a clear price confirmation occurs.
WTI fell to $63.8 on Monday as markets await more OPEC+ supply. The group just added 548,000 b/d to the global oversupply picture. US production hit a record 13.58 million b/d and the world’s largest fuel market is refilling fast.
Demand is also waning. The end of the US summer driving season historically reduces gasoline consumption and refiners have less incentive to draw down crude. Traders are also watching India after the US imposed new tariffs and India has to curb Russian imports. That’s why crude can’t sustain rallies despite geopolitical risks.
WTI Crude Oil Triangle Pattern Shapes Outlook
WTI is coiling in a contracting triangle since mid-August. The price action is making higher lows near $63.67 and lower highs around $64.75-$65.12, a setup that usually precedes a breakout.
• WTI crude futures drop to $63.8 per barrel on Monday
• Oversupply fears grow as OPEC+ accelerates output increases
• US demand outlook weakens with end of summer driving season
• Russia-Ukraine war and US sanctions risks provide limited support— Amit Gupta (@amit_gupta444) September 1, 2025
Momentum is neutral but balanced. The RSI is 53, not overbought or oversold. The MACD is flat around zero but the signal lines are about to cross up if upside pressure builds. The 50-period SMA is $63.83 and the 200-period SMA is $64.65. Recent candles are Doji-like near support, showing hesitation not commitment. There’s no strong bearish reversal signal—no shooting star or engulfing candle—so both bulls and bears are waiting for confirmation.
Five Levels Traders Should Watch
The triangle’s range is contracting so there will be a volatility spike. For traders it’s about preparing not predicting:
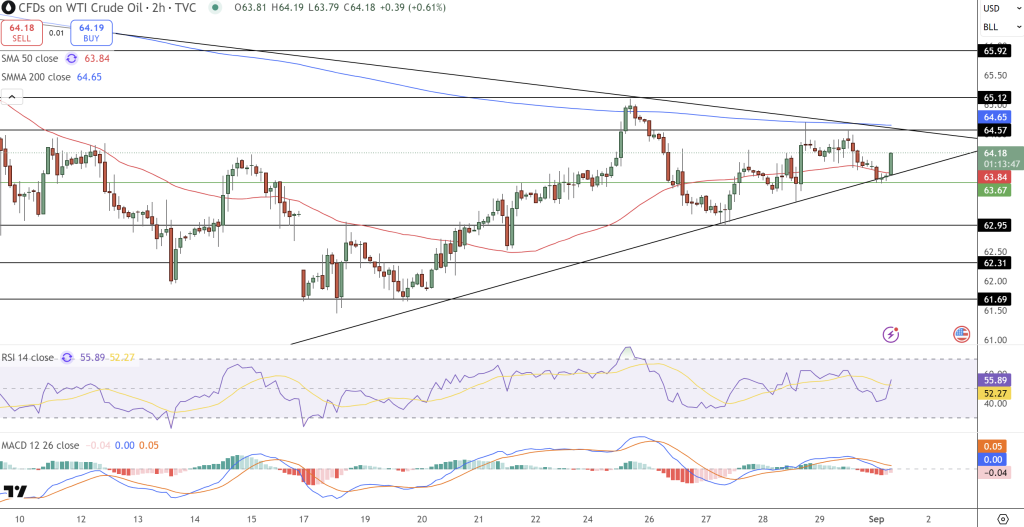
- Bull trigger: Above $64.75 to $65.92 and $66.50.
- Bear trigger: Below $63.67 to $62.95 and $62.31.* Support: 50-SMA ($63.83)
- Resistance: 200-SMA ($64.65)
- Risk: Triangle compression means the breakout will be fast and wild.
For new traders the simplest approach is to treat the triangle like a pressure cooker—wait for the release then follow. A breakout above $64.75 with a stop inside the pattern goes to $65.92-$66.50. A break below $63.67 goes to $62.95-$62.31 with stops tight to manage risk.
Until price confirms, patience is key. The market is 50/50 between supply driven bearishness and technical bounce. When the triangle resolves the move will be quick.
- Check out our free forex signals
- Follow the top economic events on FX Leaders economic calendar
- Trade better, discover more Forex Trading Strategies
- Open a FREE Trading Account