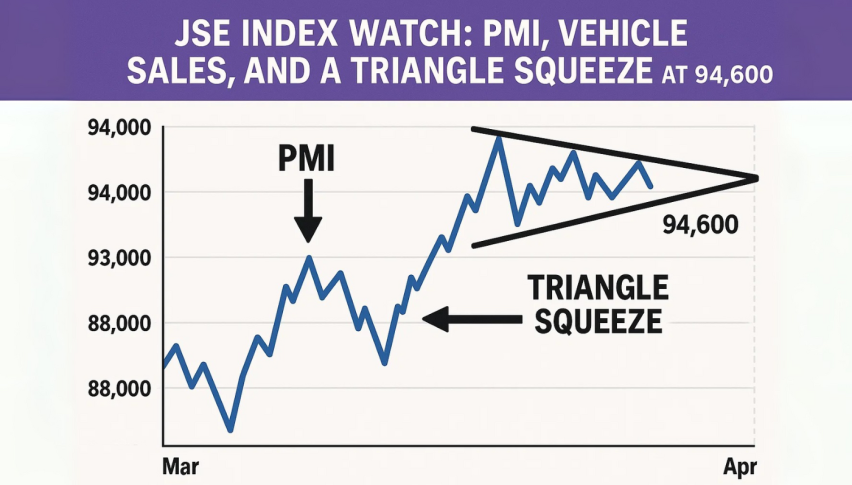
JSE Index Watch: PMI, Vehicle Sales, and a Triangle Squeeze at 94,600
JSE FTSE All Share Index (JALSH) up 560.77 points or 0.55% to 102,396.36 ZAR on Monday as SA markets are cautiously optimistic...
Quick overview
- The JSE FTSE All Share Index rose by 560.77 points, or 0.55%, reaching 102,396.36 ZAR as South African markets remain cautiously optimistic ahead of economic data.
- Investors are focused on the upcoming Absa PMI and vehicle sales figures, which are crucial for assessing manufacturing and consumer demand.
- The PMI rose to 50.8 in July, indicating the first manufacturing expansion since October 2024, while vehicle sales are expected to slow to 13.9% in August.
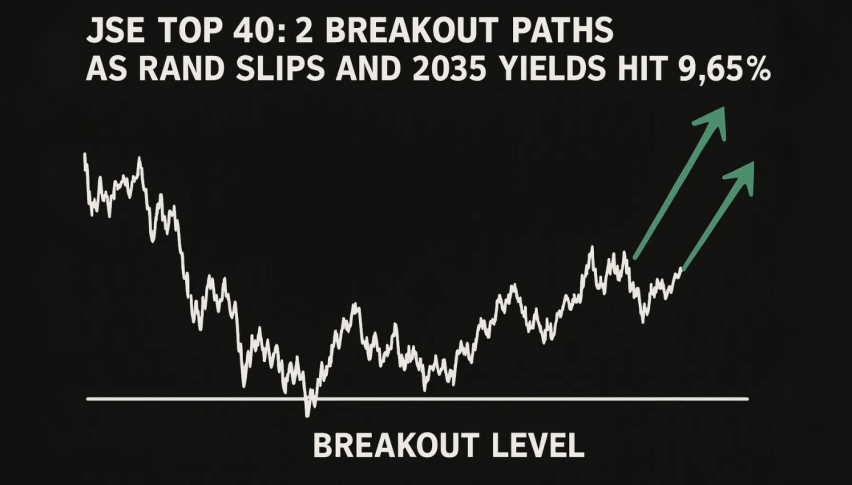
- The JSE Top 40 Index is currently in a symmetrical triangle pattern, with traders awaiting a breakout to determine the next market direction.
JSE FTSE All Share Index (JALSH) up 560.77 points or 0.55% to 102,396.36 ZAR on Monday as SA markets are cautiously optimistic ahead of new economic data.
The rand was steady in early trade as investors await the Absa PMI release at 09:00 GMT and vehicle sales figures later in the day. Both will give a better picture of manufacturing and consumer demand, key drivers of SA’s short-term growth.
PMI and Vehicle Sales in Focus
SA’s PMI rose to 50.8 in July, the first expansion in manufacturing since October 2024 after nine months of contraction. The August reading will tell us if that rebound has legs.
- PMI above 50 → Manufacturing expansion
- PMI below 50 → Contraction risk returns
- Trend → July broke nine-month contraction streak
Vehicle sales are expected to slow to 13.9% in August from 15.6% in July. Economists note softer consumer demand despite improved financial conditions from rate cuts and stable inflation.
Bond markets are cautious, the 2035 yield up to 9.614%.
JSE Top 40 Technical Analysis
The JSE Top 40 Index is trading at 94,607, in a symmetrical triangle defined by lower highs and higher lows. This is a volatility breakout setup.
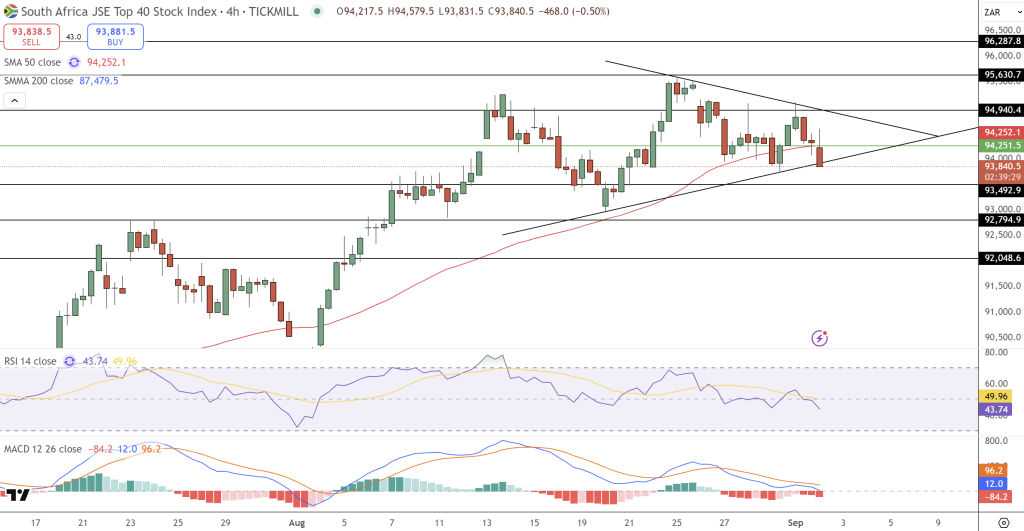
- Support 94,345 (50-SMA)
- Resistance 94,940 (upper triangle boundary)
Candlestick action is indecisive, the RSI is 52 and the MACD is flat, a possible crossover.
Trade Scenarios:
- Bullish Buy above 94,940, target 95,630-96,280
- Bearish Sell below 94,345, target 93,490-92,795
Momentum is muted and price is tight, traders are waiting for a breakout. A decisive move will determine the next direction.
- Check out our free forex signals
- Follow the top economic events on FX Leaders economic calendar
- Trade better, discover more Forex Trading Strategies
- Open a FREE Trading Account