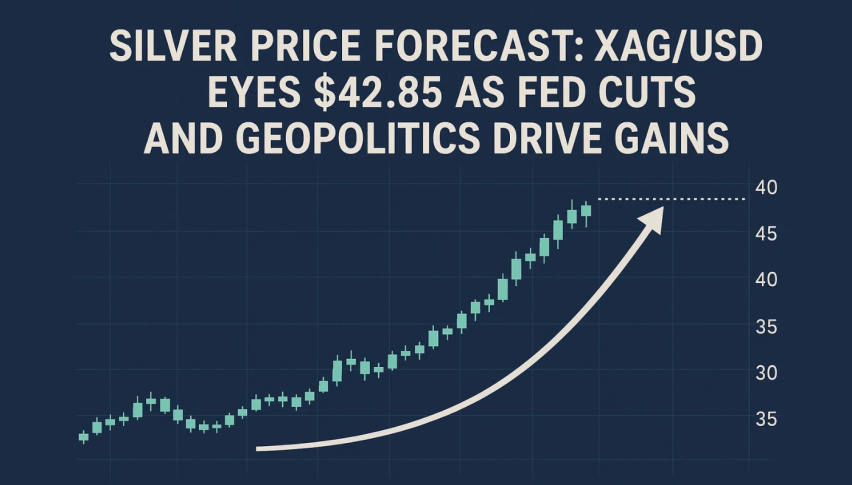
Silver Price Forecast: XAG/USD Eyes $42.85 as Fed Cuts and Geopolitics Drive Gains
Silver is holding above $41.30 as the market absorbs weak US labor data and rising expectations of a Fed rate cut on September 16-17.
Quick overview
- Silver is trading above $41.30 as weak US labor data and expectations of a Fed rate cut bolster its appeal.
- The US Nonfarm Payrolls report revealed only 22,000 jobs added in August, significantly below expectations, contributing to a dovish outlook.
- Political instability globally, including leadership changes in Japan and France, is driving investors towards safe-haven assets like silver.
- Technical analysis indicates silver has potential for further gains, with resistance at $41.57 and targets of $42.22 and $42.85.
Silver is holding above $41.30 as the market absorbs weak US labor data and rising expectations of a Fed rate cut on September 16-17. US Nonfarm Payrolls showed only 22,000 jobs added in August, well below 75,000 expected. Unemployment rate rose to 4.3% and wage growth slowed, so at least 25bps cut expected.
This dovish outlook has kept the US Dollar near its weakest since late July and is boosting demand for non-yielding safe-haven metals. Silver’s rally has mirrored gold’s, as investors turn to precious metals as a hedge against policy uncertainty.
Political and Geopolitical Risks Add Support
Beyond US data, global political turmoil is adding to silver’s safe-haven appeal. Japan’s PM Shigeru Ishiba resigned, France’s PM Francois Bayrou lost a confidence vote and tensions in Eastern Europe remain high after new sanctions threats, so investors are flowing into defensive assets like silver.
Industrial demand for silver is still strong, with renewable energy and electronics manufacturing supporting longer term demand.
Silver Technical Setup Shows Room to Run
On the 2-hour chart, silver is at $41.32, just below $41.57 resistance. Price is in an ascending channel, with higher lows. 50-SMA at $41.00 is short term support, 200-SMA at $38.88 is the longer term trend line.
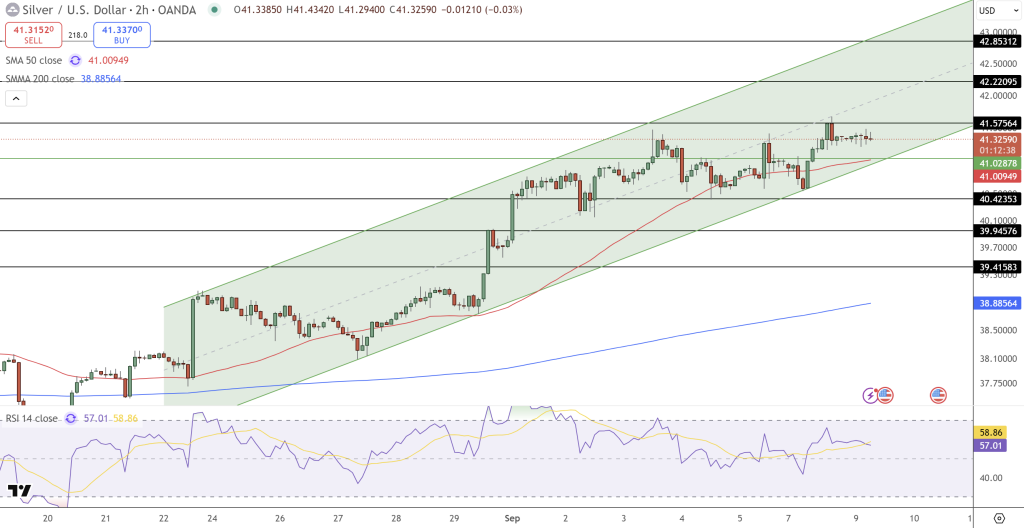
RSI is 57, so still room to run. Above $41.57 could see $42.22 and then $42.85, the top of the channel. Below $41.00 and then $40.42.Above $41.57, long to $42.22 and $42.85, stop below $41.00. If price rejects resistance and forms a reversal candle (Doji or shooting star) then look for pullback to $40.42 before reassessing.
Classic trend following setup: wait for confirmation at resistance, manage risk with stops, aim for higher resistance.
- Check out our free forex signals
- Follow the top economic events on FX Leaders economic calendar
- Trade better, discover more Forex Trading Strategies
- Open a FREE Trading Account