Forex Signals Sept 11: US CPI Inflation Pops to 2.6%, Adobe and Kroeger Earnings
US producer price inflation cooled more than expected in August, but the CPI data today jumped 3 points higher.
•
Last updated: Thursday, September 11, 2025

Quick overview
- US producer price inflation cooled more than expected in August, with the headline PPI falling -0.1% month-over-month.
- July wholesale sales surged +1.4%, leading to a slight increase in the Atlanta Fed's GDP estimate from 3.0% to 3.1%.
- Markets are anticipating the upcoming US CPI inflation data, with expectations of a 0.3% monthly increase for both headline and core figures.
- Gold prices reached a new record high of $3,674, although a bearish candlestick pattern suggests a potential pullback.
US producer price inflation cooled more than expected in August, but the CPI data today jumped 3 points higher.
Softer PPI Data
The August Producer Price Index (PPI) came in weaker than anticipated, with headline PPI fell -0.1% month-over-month, while expectations were for a +0.3% rise. Excluding food and energy, PPI also dropped -0.1% m/m.
Year-over-year, the headline figure eased to 2.6% vs. 3.3% expected, while core ex-food and energy slowed to 2.8% vs. 3.5% expected. The softer data initially pushed the US dollar lower, though it later steadied into a mixed close.
Wholesale Data Surprises
July wholesale sales surged +1.4%, well above the prior month’s +0.3% and the consensus +0.2%. Inventories, however, rose only +0.1%, just shy of expectations. While often overlooked, wholesale inventory shifts directly affect GDP readings. Following the release, the Atlanta Fed’s GDP estimate edged higher from 3.0% to 3.1%, suggesting modestly stronger growth momentum.
Key Market Events to Watch Today
ECB and European Trade Updates
Ahead of Thursday’s policy decision, markets assign a 99% probability that the ECB will keep its deposit rate at 2.0%, as confirmed by a Reuters survey. President Christine Lagarde has maintained that monetary policy remains “in a good place,” signaling no urgency to adjust rates.
Meanwhile, the recent US-EU trade deal softened tariffs on European imports, reducing the rate from a threatened 30% to 15%. Despite lingering trade concerns, Eurozone Q2 growth held up better than expected.
US CPI report highlights for August 2025
- US August CPI 2.9% y/y vs 2.9% expected
- Prior was +2.7
- m/m reading at +0.4% vs +0.3% expected (unrounded consensus was +0.36%)
- Month-over-month unrounded % vs +0.287% prior
Core CPI:
- Core CPI +3.1% vs +3.1% expected
- Core CPI m/m +0.3% vs +0.3% expected (some forecasts were +0.27%)
- Core unrounded +0.346% vs +0.228% m/m prior (almost rounded to +0.4%)
- Real weekly earnings -0.1% vs +0.4% prior (revised to +0.1%)
- Core goods prices +0.3% vs +0.2% prior
- Core services +0.3% vs +0.4% prior
- Core services ex shelter +0.2% vs +0.3% prior
- Core-CPI services ex-rent/OER +0.2% vs +0.3% prior
- Services ex energy +0.3% vs +0.4% prior
- Owners equivalent rent +0.4% vs +0.3% prior
Earnings Today
Adobe Inc. (ADBE)
- Q3 2025 Earnings Announcement
- Scheduled: After Market Close (AMC)
- Expected EPS: $5.18
The Kroger Co. (KR)
- Q2 2025 Earnings Announcement
- Scheduled: Before Market Open (BMO)
- Expected EPS: $0.91
Last week, markets were quite volatile again, with gold soaring to $3,600. EUR/USD continued the upward move toward 1.17, while main indices closed higher. The moves weren’t too big though, and we opened 35 trading signals in total, finishing the week with 23 winning signals and 12 losing ones.
Gold Forms Reversing Candlestick After Reaching $3,674
Meanwhile, gold continues to attract strong safe-haven flows although we saw a slight pullback yesterday. Prices surged above $3,674 early yesterday, hitting a new record high, so buyers are in total control, while China has resumed buying bullion. Technical charts now highlight the $3,700 level as the next major resistance, which will be broken soon as the upside accelerates, however an upside-down daily candlestick is a bearish signal, which could indicate a deeper pullback after such a rally.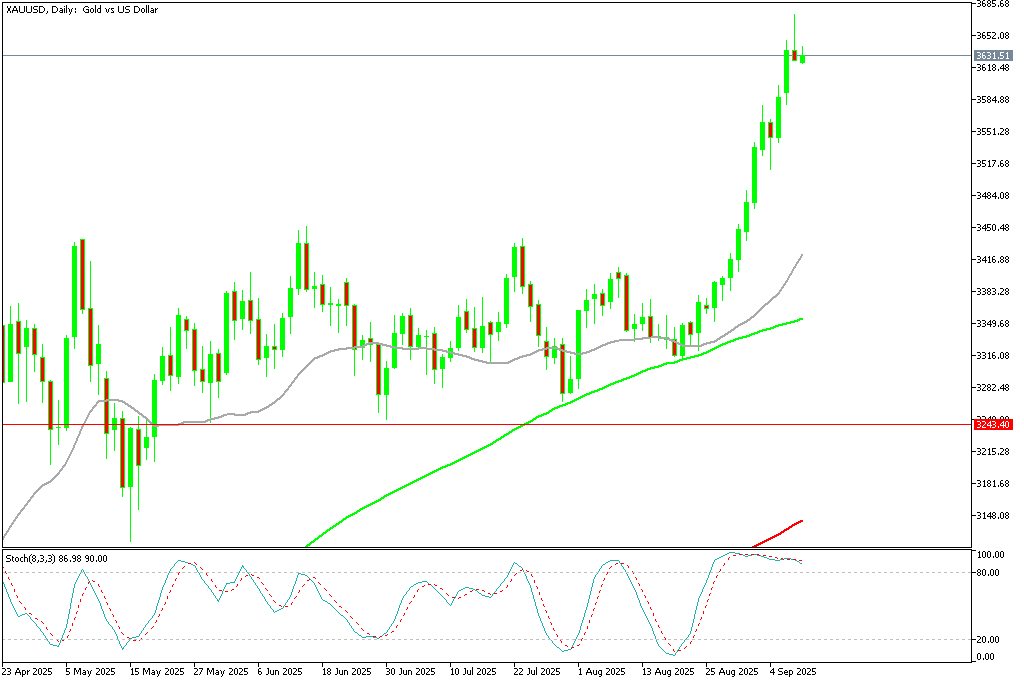
USD/JPY Continues Trading in the Range
Foreign exchange markets saw sharp swings. Early in the week, U.S. yield differentials and Japanese capital outflows pushed the dollar above ¥150, but disappointing U.S. jobs data triggered profit-taking, causing the USD/JPY to slide by four yen from its peak. The move underscored persistent volatility as traders weighed Japan’s intervention risks against evolving Fed expectations.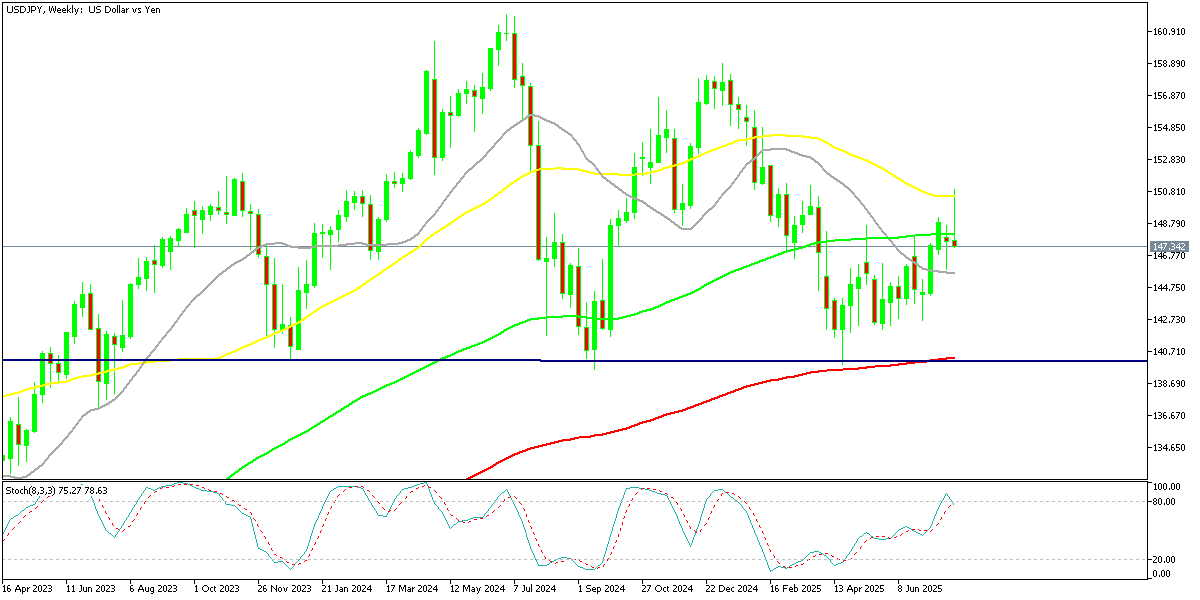
USD/JPY – Weekly Chart
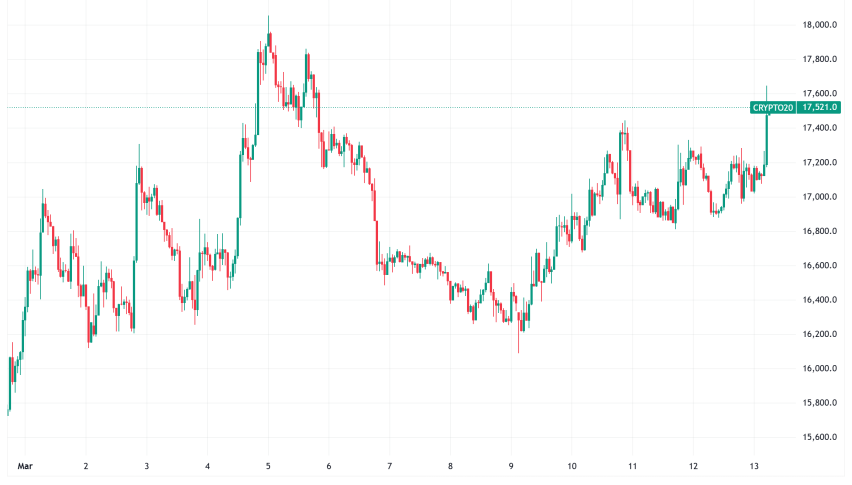
Cryptocurrency Update
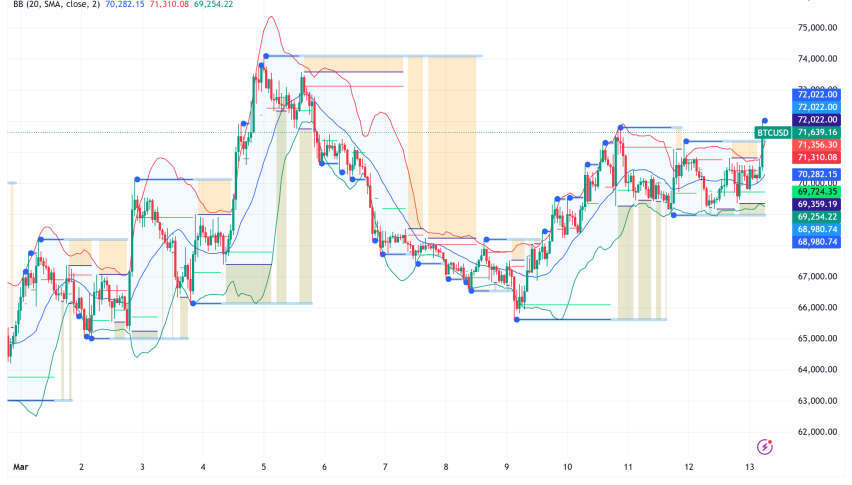
Bitcoin Starts Rebound Off the 20 SMA
Cryptocurrencies remained highly active over the summer. Bitcoin (BTC) climbed to fresh highs of $123,000 and $124,000 in July and August, supported by institutional inflows and technical strength. However, remarks from Treasury Secretary Scott Bessent ruling out U.S. increases to BTC reserves triggered a steep pullback, sending the coin down to $113,000 before recovering above $116,000 last week, however sellers returned and sent BTC below $110,000, however we saw a rebound off the 20 weekly SMA (gray) yesterday.
BTC/USD – Weekly chart
Ethereum Heads to $4,500
Ethereum (ETH) has been similarly strong, surging toward $4,800, its highest since 2021 and near its all-time peak of $4,860. Despite a dip last week, ETH found support at the 20-day SMA, with retail enthusiasm and renewed institutional participation driving fresh upside momentum. However buying resumed and on Sunday ETH/USD printed another record at $4,941. However we saw a retreat to $,000 lows over the weekend, but yesterday buyers returned.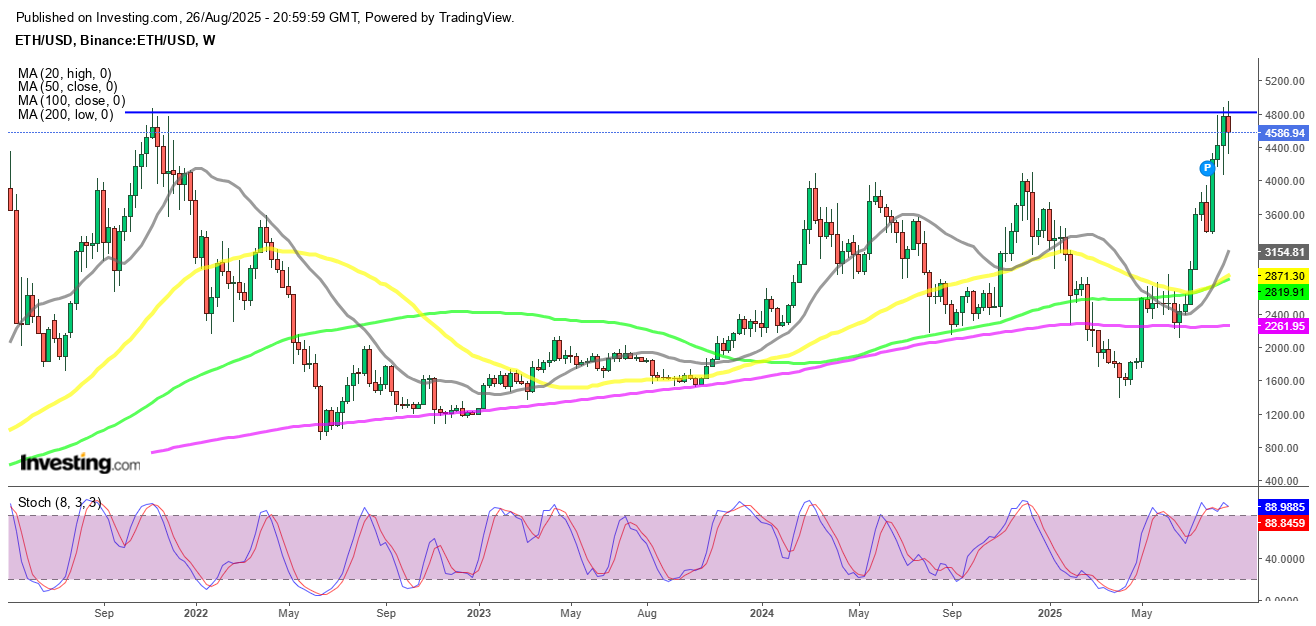
ETH/USD – Daily Chart
- Check out our free forex signals
- Follow the top economic events on FX Leaders economic calendar
- Trade better, discover more Forex Trading Strategies
- Open a FREE Trading Account
- Read our latest reviews on: Avatrade, Exness, HFM and XM
ABOUT THE AUTHOR
See More
Skerdian Meta
Lead Analyst
Skerdian Meta Lead Analyst.
Skerdian is a professional Forex trader and a market analyst. He has been actively engaged in market analysis for the past 11 years. Before becoming our head analyst, Skerdian served as a trader and market analyst in Saxo Bank's local branch, Aksioner. Skerdian specialized in experimenting with developing models and hands-on trading. Skerdian has a masters degree in finance and investment.
Related Articles
Sidebar rates
Related Posts
