Silver Surges 70% Toward $50: Is This Rally Stronger Than 1980 & 2011?
Silver (XAG/USD) is once again testing the legendary $50 barrier, a level that has triggered dramatic reversals in both 1980 and 2011.
Quick overview
- Silver (XAG/USD) is testing the $50 barrier, a significant level that has historically caused reversals in 1980 and 2011.
- The current rally is supported by strong fundamentals, with silver up over 70% year-to-date and a bullish long-term trend since 2022.
- Unlike past peaks, this rise is driven by structural demand and a weaker U.S. dollar, rather than speculative excess.
- Analysts predict that a decisive close above $50.05 could lead to new all-time highs, marking the beginning of a sustainable bull market.
Silver (XAG/USD) is once again testing the legendary $50 barrier, a level that has triggered dramatic reversals in both 1980 and 2011. But this time, the story feels different. The metal has surged over 70% year-to-date, trading near $49.33—its highest level in more than four decades—yet without the signs of speculative excess that defined those past peaks.
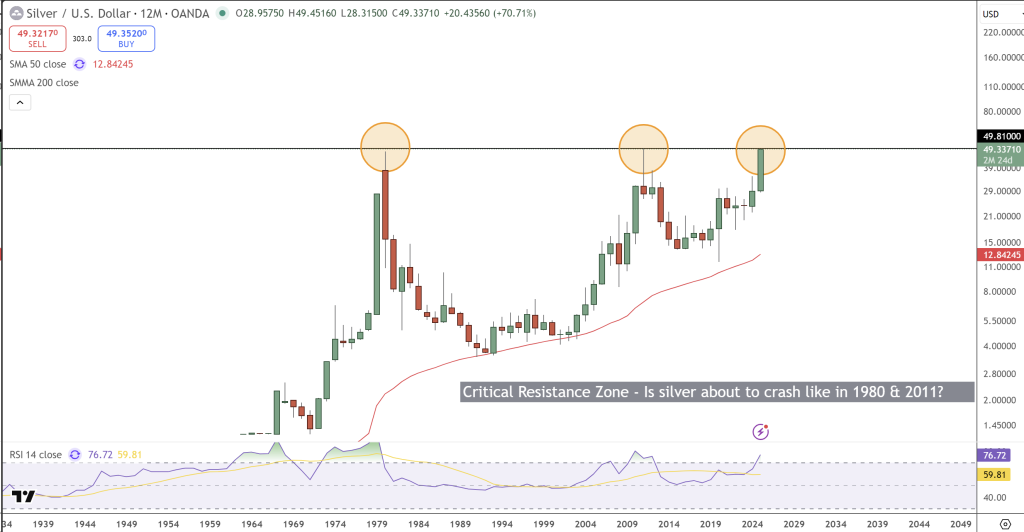
The solid rally is supported by series of supported fundamentals. Silver (XAG/USD) long-term trend has been bullish steadily since 2022, forming a clear pattern of higher highs and higher lows.
Whereas, the 50-month SMA ($12.84) remains a strong foundation for this uptrend, signaling deep market support. Meanwhile, the monthly RSI near 76 points to strong momentum—vigorous, but still short of the euphoric levels that preceded previous crashes.
What Makes This Cycle Different
In 1980, silver’s spike was fueled by the Hunt Brothers’ market cornering. In 2011, it was the flood of money from post-crisis quantitative easing. This time, bullish price action is triggered by a actual shift in structural demand and a broader macroeconomic backdrop:
- Weaker U.S. Dollar: As the US dollar softens, dollar-denominated metals like silver gain traction.
- Industrial Demand: Silver’s crucial role in solar panels, semiconductors, and electric vehicles has turned it into a strategic commodity.
- Investment Flows: Renewed institutional and retail interest is boosting ETFs and futures positioning.
Inflation-adjusted figures also tell a compelling story. The 1980 peak of $49.45 equals roughly $199 today, while the 2011 high of $48.70 adjusts to around $72. That means today’s price—around $49—is still far from historic “real” highs, leaving ample room for upside before reaching overvaluation.
Can Silver Finally Break Its Ceiling?
In the near term, silver may pause before making its next move. The RSI near 65 on the 4-hour chart suggests mild overextension, which could trigger a short-term pullback toward $48.70–$47.50 before resuming its climb.
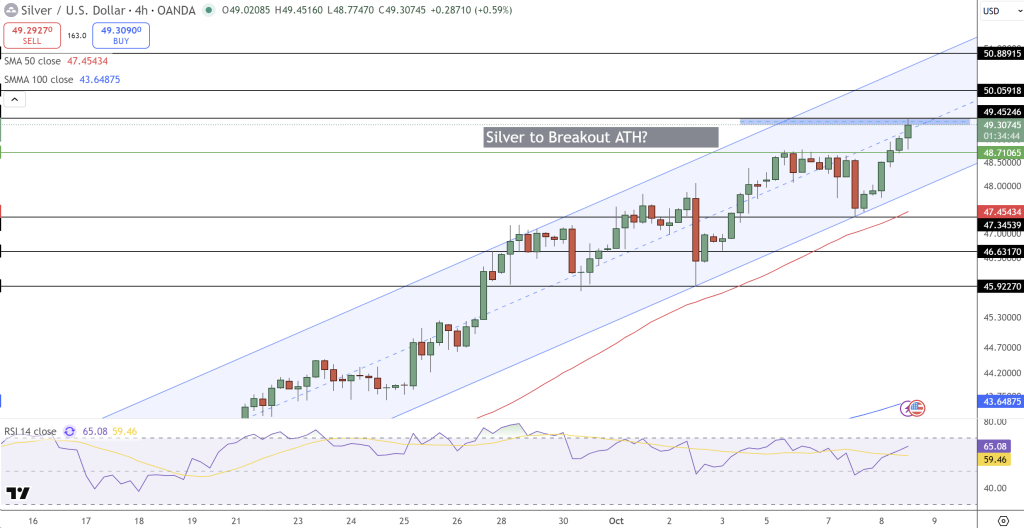
Still, momentum remains firmly bullish. A decisive close above $50.05 would set a new all-time high, erasing losses held since 2011 and unleashing fresh buying from investors who’ve waited over a decade for a breakout.
If that occurs, analysts expect targets between $55 and $60, marking the start of a new era for silver—a sustainable, industrial-led bull market rather than a fleeting speculative spike.
In short, this rally is not a replay of 1980 or 2011. Silver’s rise today reflects a market that’s evolving, not overheating—and for long-term investors, that’s a reason to stay focused rather than fearful.
- Check out our free forex signals
- Follow the top economic events on FX Leaders economic calendar
- Trade better, discover more Forex Trading Strategies
- Open a FREE Trading Account
- Read our latest reviews on: Avatrade, Exness, HFM and XM
Related Articles

Sidebar rates
Related Posts
