Bitcoin Holds Above $121K Amid Growing Bearish Pressure and Technical Weakness
Bitcoin is currently trading above $121,000. It has been rather stable over the previous 24 hours, even if traders are becoming more worried
Quick overview
- Bitcoin is currently trading above $121,000 but faces significant bearish pressure and potential support tests.
- The cryptocurrency briefly dipped below $120,000, indicating vulnerability and a possible test of support levels around $114,000.
- Market analysis suggests a fragile support structure with more sell orders at higher prices, leading to a likely dominance of new shorts.
- Despite near-term risks, some analysts remain optimistic about Bitcoin's long-term potential, predicting significant price increases if key resistance levels are broken.
Bitcoin BTC/USD is currently trading above $121,000. It has been rather stable over the previous 24 hours, even if traders are becoming more worried about possible losses. As bearish technical indicators build up and market momentum slows, the leading cryptocurrency is about to confront important tests at key support levels.
BTC/USD Technical Analysis Points to Vulnerability at Current Levels
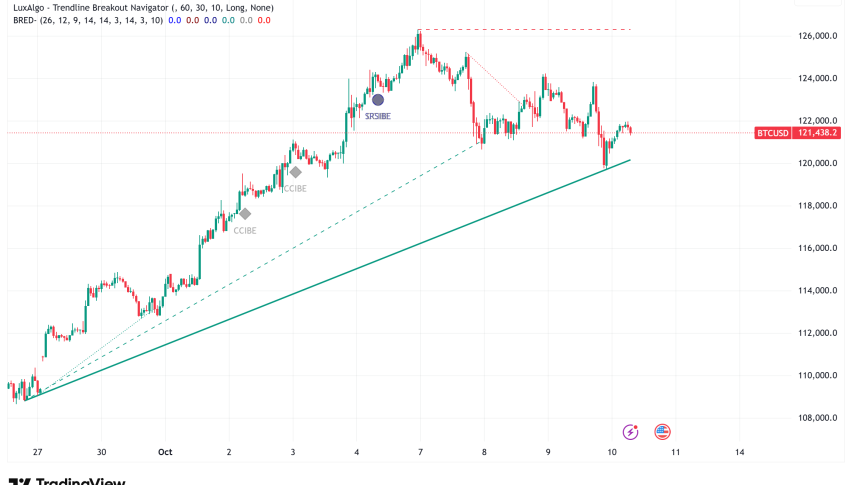
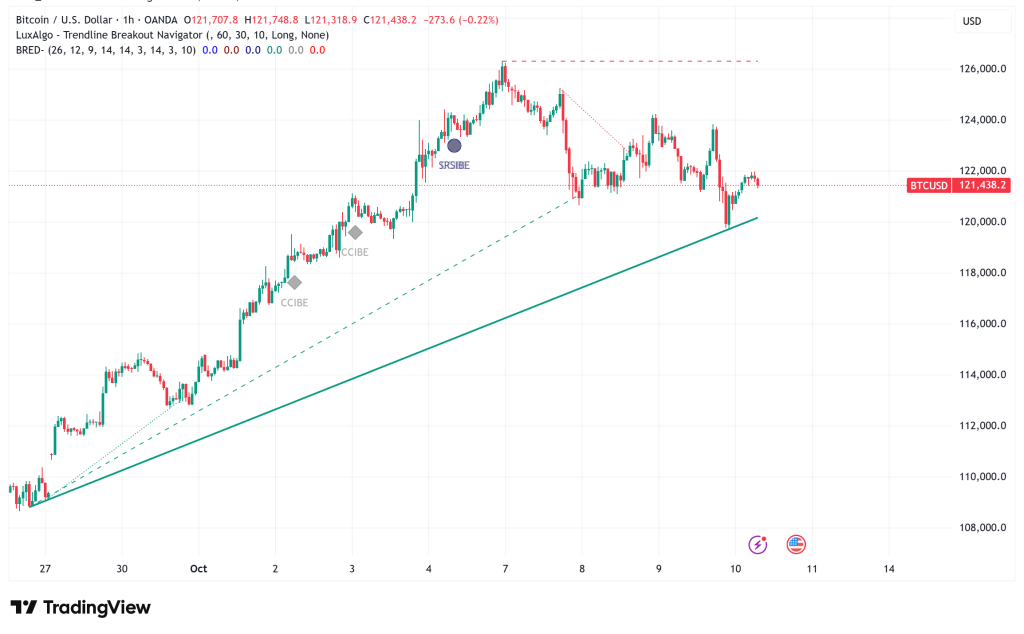
On Thursday, Bitcoin briefly fell below the crucial $120,000 level, losing almost 3% of its value in one day and hitting a low of $119,810 before bouncing back. According to Material Indicators, the cryptocurrency is now facing its third daily support test in a row at a key trend line. If the price breaks below this trend line, it could test support below $114,000.
Trading resource Material Indicators says, “losing the trend line would open the door to a support test at the Q4 Timescape Level at $114k.” This shows how risky Bitcoin is right now, even though it has reached new all-time highs.
The hourly chart shows that a bearish trend line is emerging, with $122,750 acting as resistance. Bitcoin is trading below both $121,500 and its 100-hour Simple Moving Average. There is immediate resistance about $121,750. The hourly MACD is gaining strength in a negative area, and the RSI has dipped below the important 50 level, both of which point to more downward pressure.
Order Book Data Reveals Fragile Support Structure
Exchange order book analysis doesn’t seem well for bulls. Trader Skew says that the market has bid liquidity between $121,000 and $120,000, but “what we need to see next is absorption of sellers to rule out a sweep lower.” The CoinGlass liquidation heatmap data shows that there isn’t much bid support below $120,000, and there are more sell orders at higher prices.
Skew thinks that new shorts will “quite likely dominate” the market in the short run, as sellers seem to have taken back control and put price discovery on hold for now.
Bearish Divergences Compound Downside Risk
Roman, a trader, points out worrying trends on higher timeframes when looking at the bigger picture. “We are once again seeing more bearish divergences, poor volume, and no momentum on HTF. He was talking about weekly and monthly charts when he said, “Both 1W and 1M.” Roman correctly predicted that the price would go from $107,000 to $124,000. Now he thinks Bitcoin might go back down to $108,000, which is the local range low.
Bearish divergences, falling volume, and slowing momentum on weekly and monthly timescales all point to the fact that the recent rise may be losing pace, even though Bitcoin has made a lot of money in 2025.
Bitcoin Price Prediction: Near-Term Risks and Long-Term Optimism
Bearish Scenario: If Bitcoin can’t stay above the $122,750 resistance level, it looks more and more likely that it will go down. Immediate support is at $120,750, while major support is at $120,000. If the market breaks down, it might go to $118,500, then $116,500, with important support at $115,500. The most-watched downside objective is still $108,000, where the local range bottom should give a good chance to recover back.
Bullish Scenario: Bitcoin has to break through the $122,750 resistance and trend line for bulls to take back control. If prices break over this level, they might go up to $123,500 and then $124,000, with the next big barrier at $125,500.
Egrag Crypto, an analyst, is still hopeful about the long-term future based on historical three-month channel patterns. He says that a “minor push” might send Bitcoin to $175,000, which would be a 43% increase from where it is now. His research shows that comparable channel breaks happened before big rallies in 2013, 2017, and 2020–2021. In some cases, the targets are as high as $250,000 or even $400,000.
- Check out our free forex signals
- Follow the top economic events on FX Leaders economic calendar
- Trade better, discover more Forex Trading Strategies
- Open a FREE Trading Account