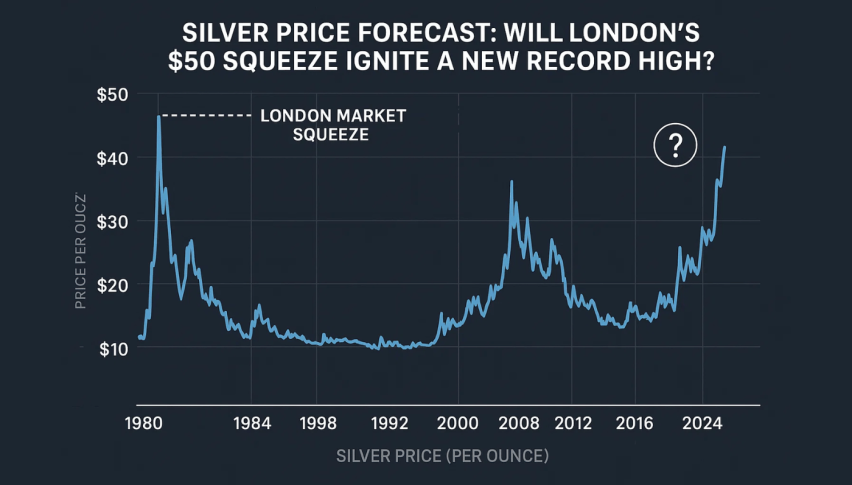
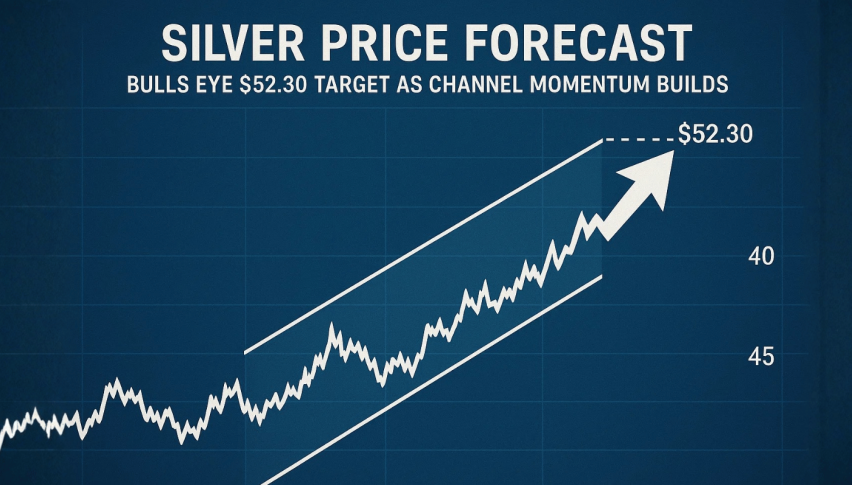
Silver Price Forecast: Bulls Eye $52.30 Target as Channel Momentum Builds
Silver (XAG/USD) is trading comfortably within its uptrend, near $49.35 after briefly testing the $50.20 resistance. The structure...
Quick overview
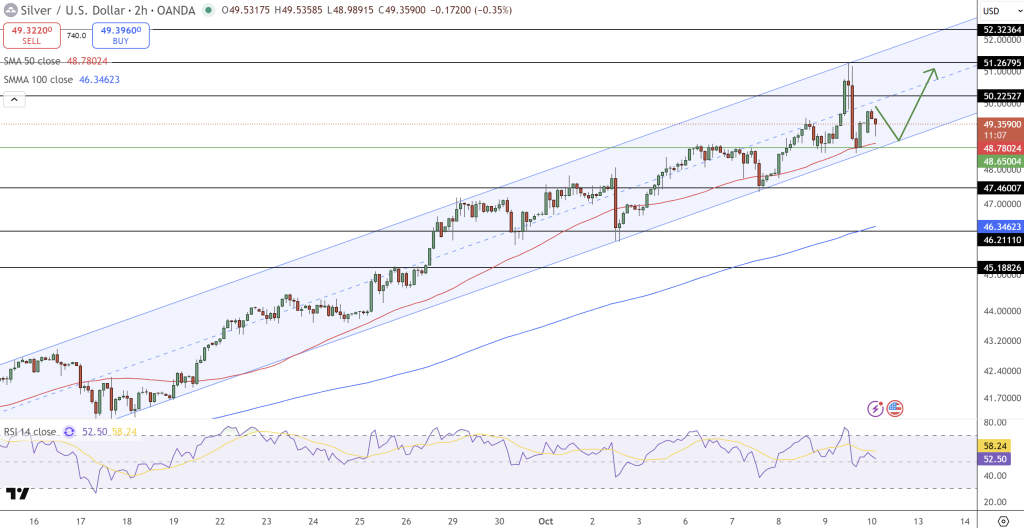
- Silver (XAG/USD) is in an uptrend, currently trading near $49.35 after testing $50.20 resistance.
- The 50-period and 100-period SMAs provide strong support at $48.78 and $46.35, respectively.
- The RSI is at a neutral 52, indicating potential for further upside without being overbought.
- Buyers are encouraged to enter around the $48.80-$49.00 range, with targets set at $51.25 and $52.30.
Silver (XAG/USD) is trading comfortably within its uptrend, near $49.35 after briefly testing the $50.20 resistance. The structure is healthy, with higher highs and higher lows – a good sign the bull run is still intact.
The 50-period Simple Moving Average (SMA) at $48.78 is short-term support, and the 100-period SMA at $46.35 is longer-term support. This double layer of support means dips are more likely to attract buyers than sell-offs.
Candlestick action also shows short-term balance. Recent candles are smaller and have longer upper wicks near resistance, indicating some hesitation from buyers – but not weakness. There’s no sign of a bearish pattern like three black crows or engulfing yet. This pullback looks like a normal retest of support within the bigger picture.
Momentum Favors Bulls Over Bears
The Relative Strength Index (RSI) is at 52, a neutral reading that gives room for more upside before it gets overbought. This balance gives silver space to go up without correcting.
Technical traders are also watching for the short-term moving averages to continue to crossover – a sign buying pressure is stronger than selling. If prices bounce from the mid-channel area, the next resistance levels are at $51.25 and then $52.30, the top of the channel.
Key Points:
- Price is in an uptrend channel.
- 50-SMA and 100-SMA are support zones.
- RSI is 52, balanced.
- Targets: $51.25 and $52.30.
All this means silver’s momentum is not just stable but building strength for the next leg up.
Silver Trade Setup and View
For those looking to get in, the $48.80-$49.00 area is a good spot. This range is support from both the dynamic SMA and the lower channel – a technical floor for longs.
If buyers hold this area, a break above $50.20 could take us to $51.25 and $52.30. But a dip below $47.45 would break the structure and could trigger a short-term correction to $46.80.
Overall silver is constructive. The market is accumulating, the moving averages are supportive and the channel is strong. As long as silver is above $48.50, dips are buying opportunities not warning signs – a theme that could keep the bulls in control for the next week.
- Check out our free forex signals
- Follow the top economic events on FX Leaders economic calendar
- Trade better, discover more Forex Trading Strategies
- Open a FREE Trading Account