Buying the Pullback in AUD/USD at the 50 SMA


AUD/USD has turned quite bullish this month. At the beginning of the month the price was trading at the lows, around 0.6670-80. But it reversed higher after the US ISM manufacturing report early this month, which showed that this sector fell deeper into contraction in the US during September.
As a result, the USD turned bearish and this pair turned higher at the beginning of this month. Then, the US and China reached a partial trade deal which helped improve the sentiment further in financial markets and risk assets surged higher, Aussie included.
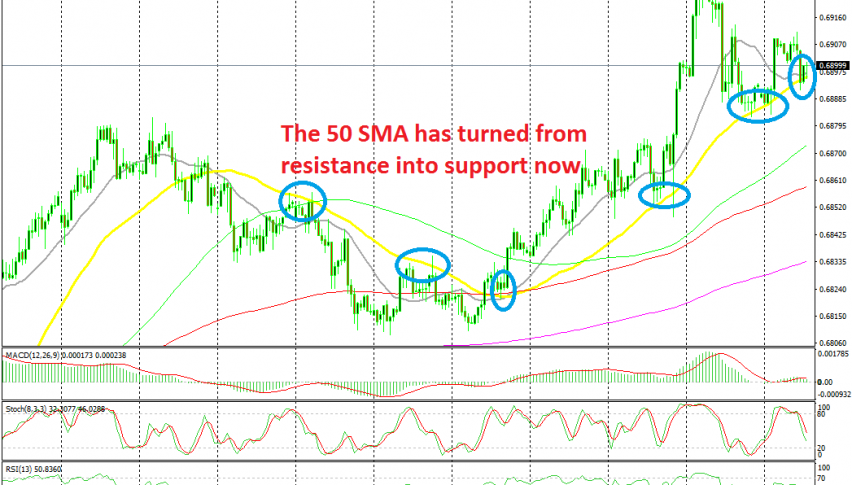
Last week, AUD/USD retraced lower, which was due after the two-week climb. During that retrace, the 50 SMA (yellow) turned into resistance on the H1 chart. This week, the uptrend resumed again and the 50 SMA turned into support, helped by the 20 SMA (grey) as well.
Last night, the price bounced off the 50 SMA but it retraced back down there during the European session today. AUD/USD is finding support at this moving average again, so we decided to go long from here, since stochastic is also overbought, indicating that the pullback is complete.