Gold Price Analysis: Trade Hype Sinks Prices—Can Bulls Rebound?
Gold fell on Monday as US-China trade talks boosted investor sentiment and the dollar. This comes as the dollar strengthened on positive...

Quick overview
- Gold prices fell as positive US-China trade talks boosted investor sentiment and strengthened the dollar.
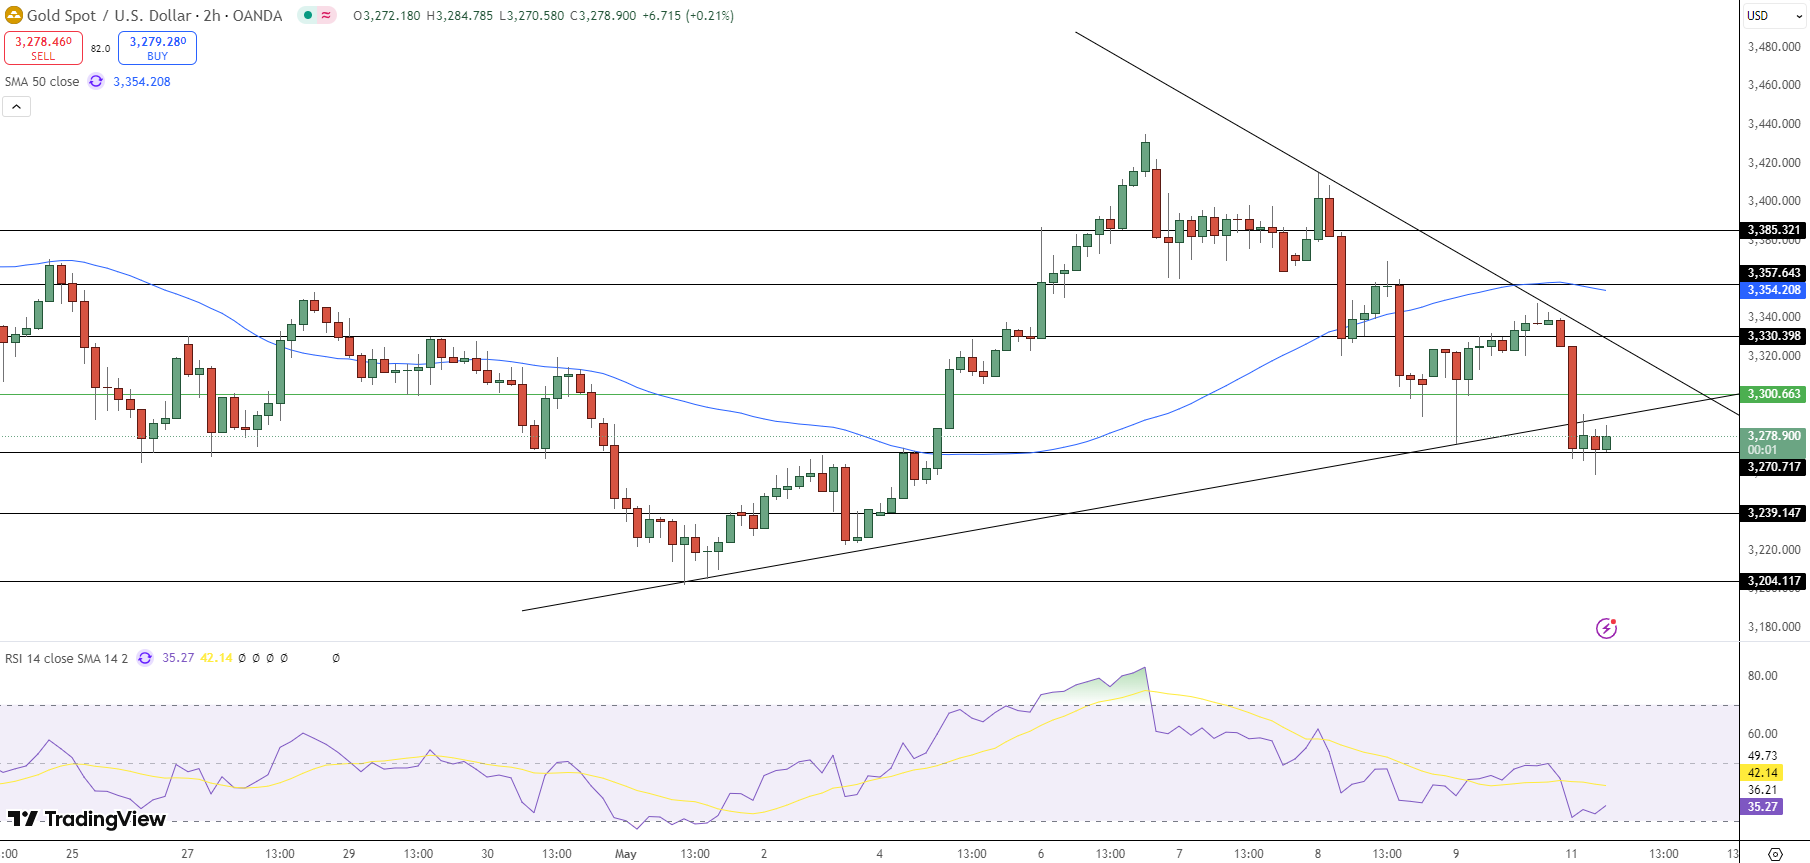
- Gold broke below $3,354, indicating a bearish trend with immediate support at $3,270.
- Chinese Vice Premier announced a forthcoming joint statement aimed at easing tariff disputes.
- Traders are advised to sell below $3,300 with a target of $3,239 and a stop loss above $3,354.
Gold fell on Monday as US-China trade talks boosted investor sentiment and the dollar. This comes as the dollar strengthened on positive trade developments which is a bearish factor for gold.
US-China Trade Weighs on Gold
Gold (XAU/USD) broke below $3,354, its 50 day SMA, after US and Chinese officials hinted at progress in trade talks. According to Jigar Trivedi, senior commodity analyst at Reliance Securities, the stronger dollar and improved trade sentiment has put pressure on gold prices.
The latest talks held in Switzerland over the weekend ended on a positive note with both sides expressing optimism to resolve their tariff disputes. Chinese Vice Premier He Lifeng said a joint statement will be released soon which should ease global recession fears.
-
US-China trade talks concluded on a positive note in Switzerland.
-
Chinese Vice Premier announced a joint statement to be released.
-
Dollar strength killed gold as risk appetite improved.
Technical Analysis: Key Levels
Gold is trading around $3,278 after breaking below $3,354, a key support. This is a bearish move with immediate support at $3,270 which is the lower boundary of a descending triangle, a bearish pattern. RSI is at 35.27 which is oversold and could trigger a short term bounce.
Immediate resistance is at $3,300 followed by $3,354. A close above this level is needed to confirm the trend reversal. Until then the broader outlook is bearish.
-
Immediate Support: $3,270
-
Next Support: $3,239
-
Immediate Resistance: $3,300
-
Major Resistance: $3,354 (50 day SMA)
Trade Setup: Cautious
Given the current setup, sell below $3,300 targeting $3,239. Stop loss above $3,354 to manage the risk as a close above this level will invalidate the bearish view.
-
Sell Below: $3,300
-
Take Profit: $3,239
-
Stop Loss: $3,354
A short term bounce is possible but overall trend is bearish. Watch out for economic data, US inflation numbers.
- Check out our free forex signals
- Follow the top economic events on FX Leaders economic calendar
- Trade better, discover more Forex Trading Strategies
- Open a FREE Trading Account
- Read our latest reviews on: Avatrade, Exness, HFM and XM
Related Articles
Sidebar rates
