Coinbase Stock (COIN) Bounces Off Key Fibonacci Support Level

Quick overview
- Coinbase (COIN) stock has rebounded from the critical golden ratio support near $145 for the second time, rallying nearly 90%.
- The monthly and weekly charts indicate bullish momentum, with MACD bullish crossovers and EMA golden crosses suggesting mid- to long-term strength.
- The daily chart is approaching a golden crossover, while the RSI nears overbought levels, indicating potential caution.
- On the 4-hour chart, mixed signals suggest caution near the $278 resistance, with potential corrective supports at $221.50 and $187.
Coinbase (COIN) stock has once again tested the critical golden ratio Fibonacci support level, triggering a significant rebound. This marks the second time COIN has found strong buying interest at this key technical juncture. The question now is whether this bounce can surpass the strength and momentum of the initial rebound observed several months ago, potentially signaling sustained bullish control.
Coinbase (COIN) Stock Bounces Off Golden Ratio Support for the Second Time
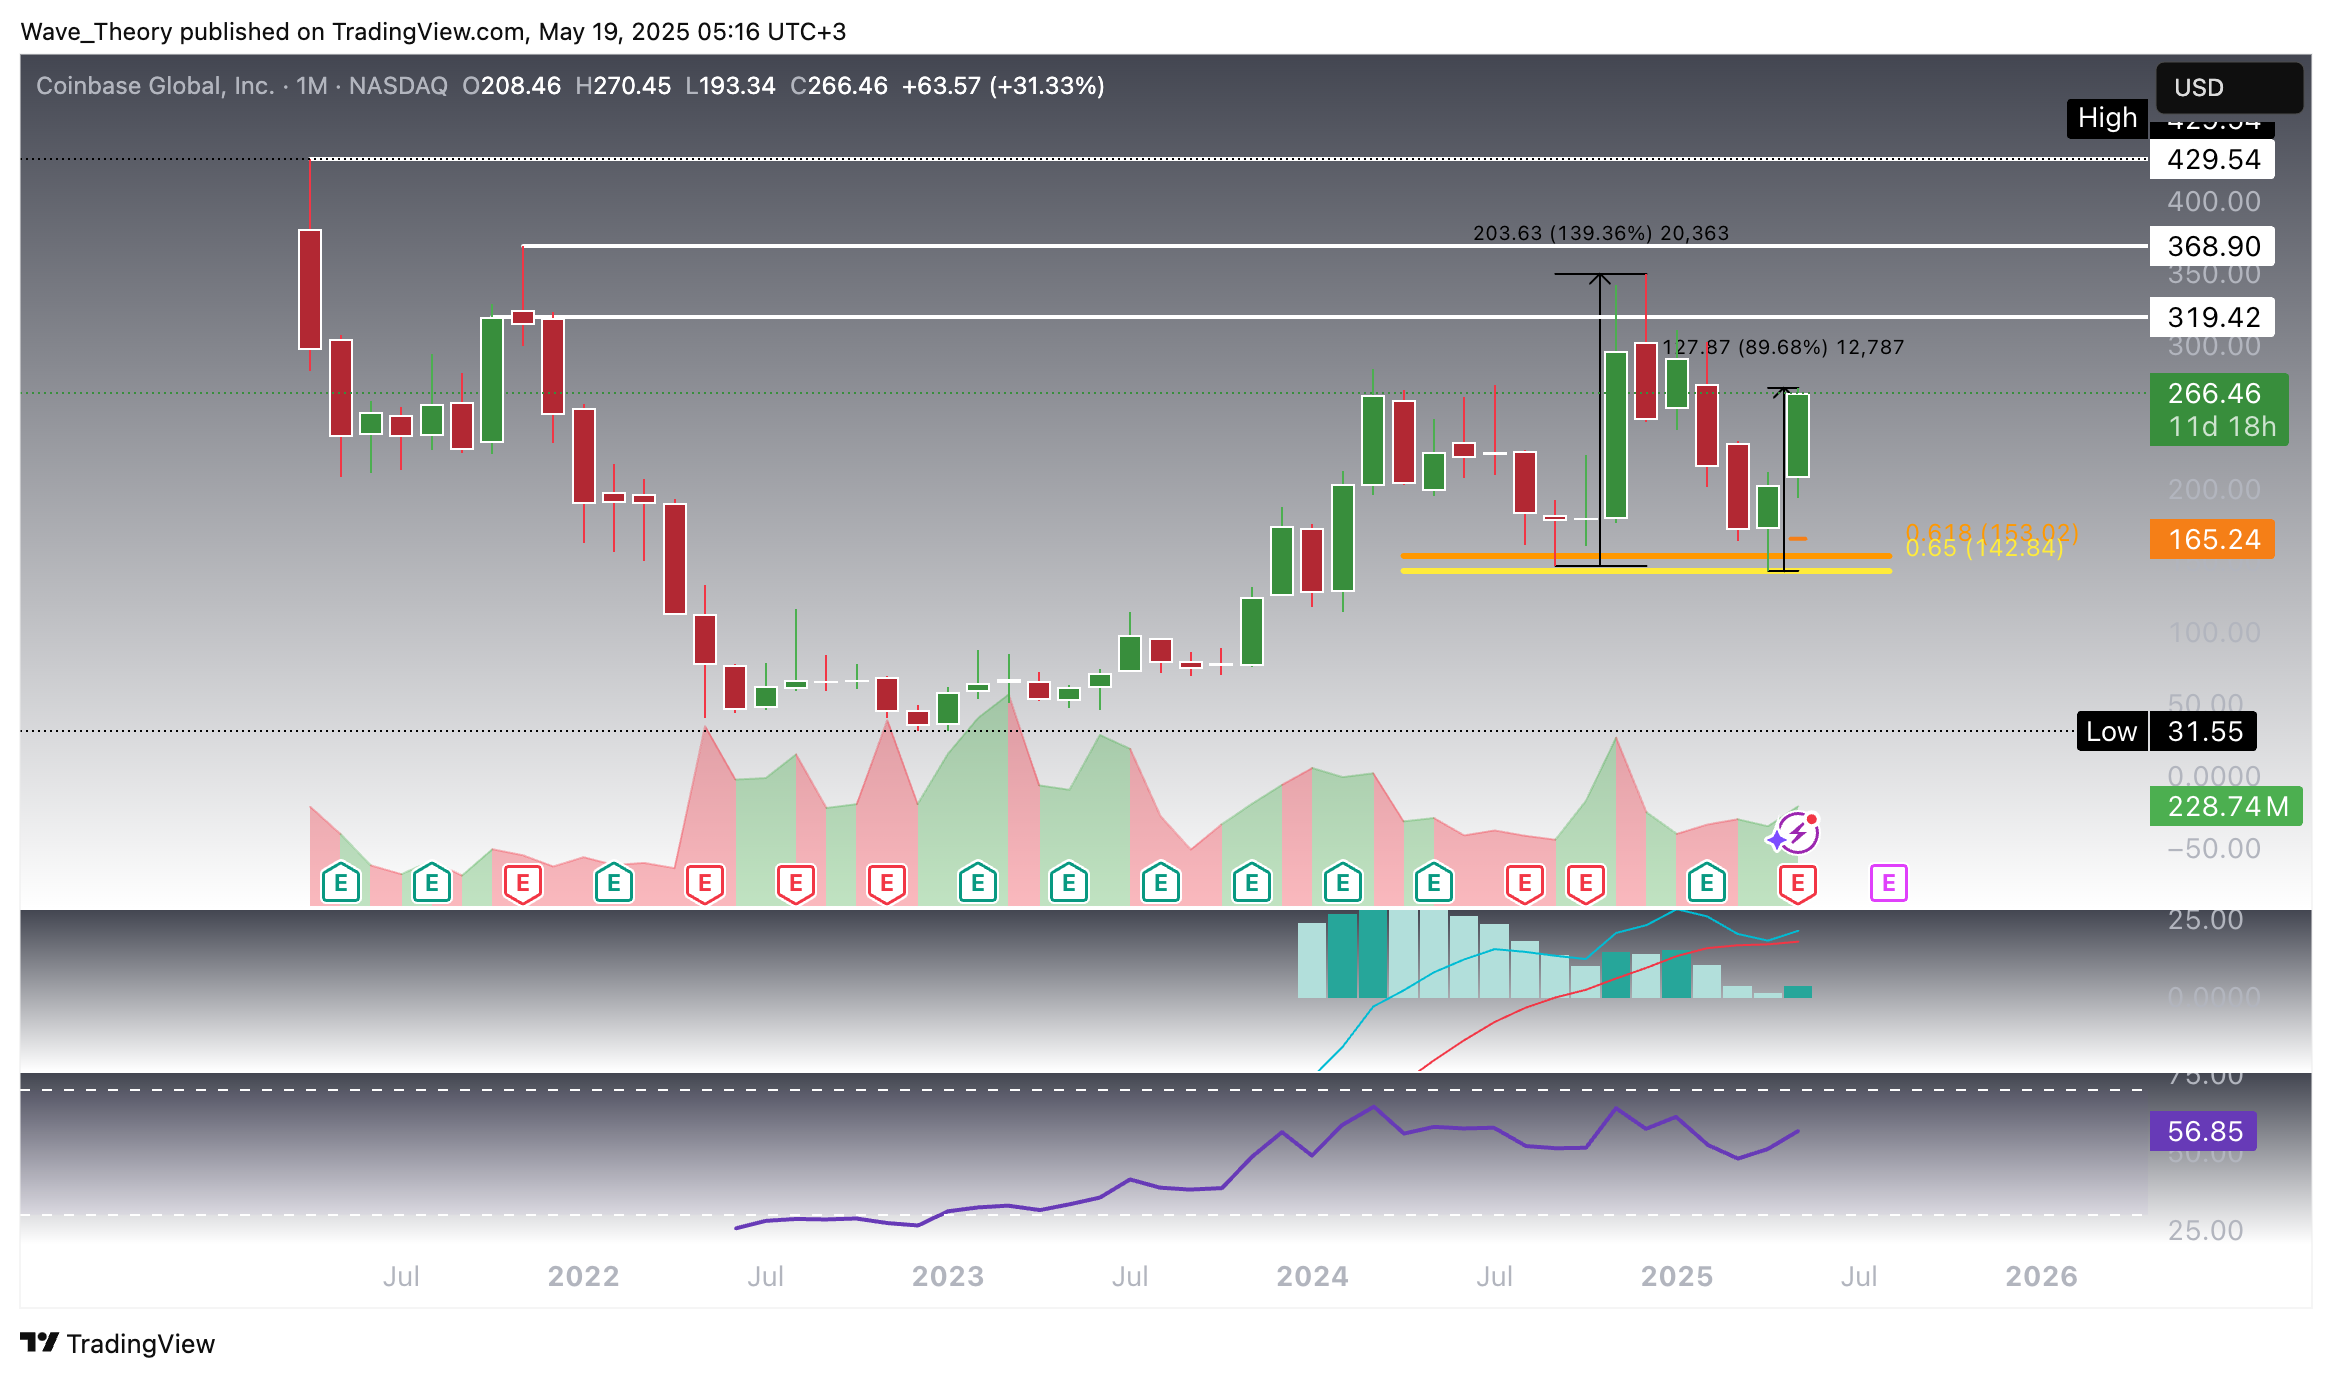
Coinbase (COIN) has once again found strong support at the critical golden ratio level near $145—the same zone where it previously rebounded with a remarkable 140% surge just a few months ago. This time, the stock has already rallied approximately 90% from that level and shows potential to continue its upward trajectory toward the resistance zone between $319 and $370. That upper boundary proved significant in the past, as COIN faced rejection there before retreating back to test the golden ratio support once more.
From a momentum perspective, the monthly MACD remains bullish, with its signal and MACD lines maintaining a positive crossover. Notably, the MACD histogram is beginning to tick higher this month after a three-month downtrend, suggesting a possible resurgence in upward momentum for Coinbase’s stock price. Meanwhile, the RSI is moving in neutral regions and gives no clear directional bias.
Coinbase Stock Approaches Critical Resistance
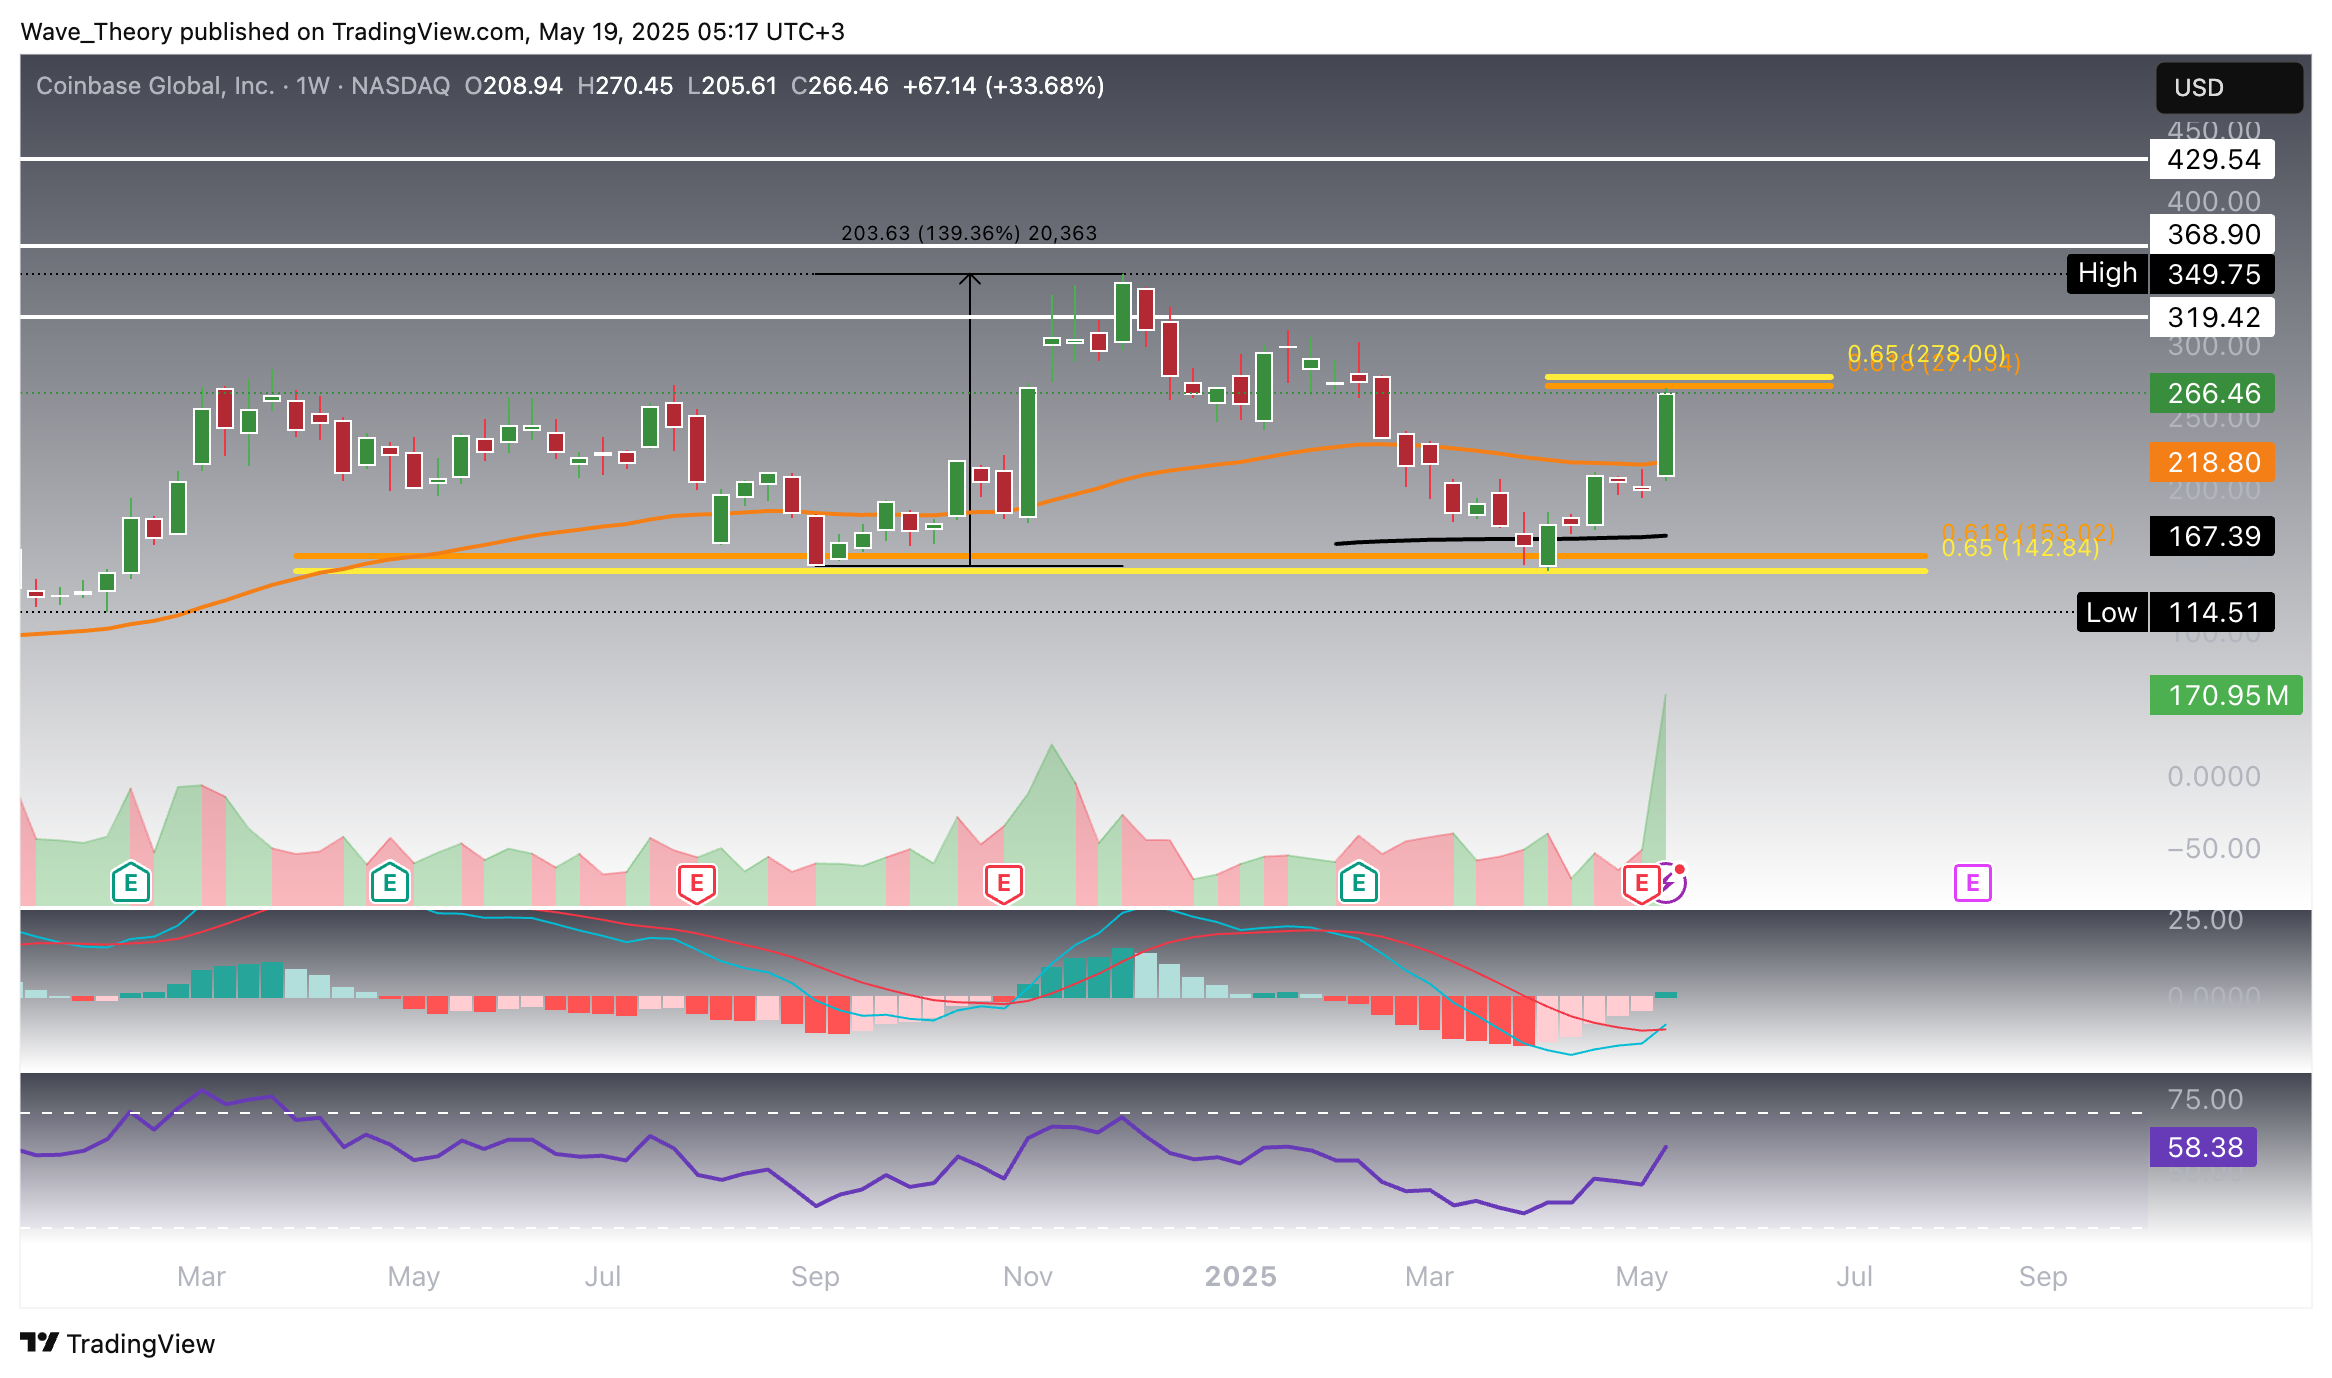
Following a strong upward move, the MACD histogram has been ticking higher over the past several weeks, with the MACD lines poised to cross bullishly. Coinbase now nears a crucial golden ratio resistance level at $278, a zone where the stock could potentially face selling pressure.
Despite this, the technical outlook on the weekly chart remains predominantly bullish. The EMAs have formed a golden crossover, reinforcing mid-term upward momentum. Meanwhile, the RSI is positioned in neutral territory, indicating neither overbought nor oversold conditions, which suggests room for further directional movement.
Coinbase Daily Chart: Golden Crossover on the Horizon
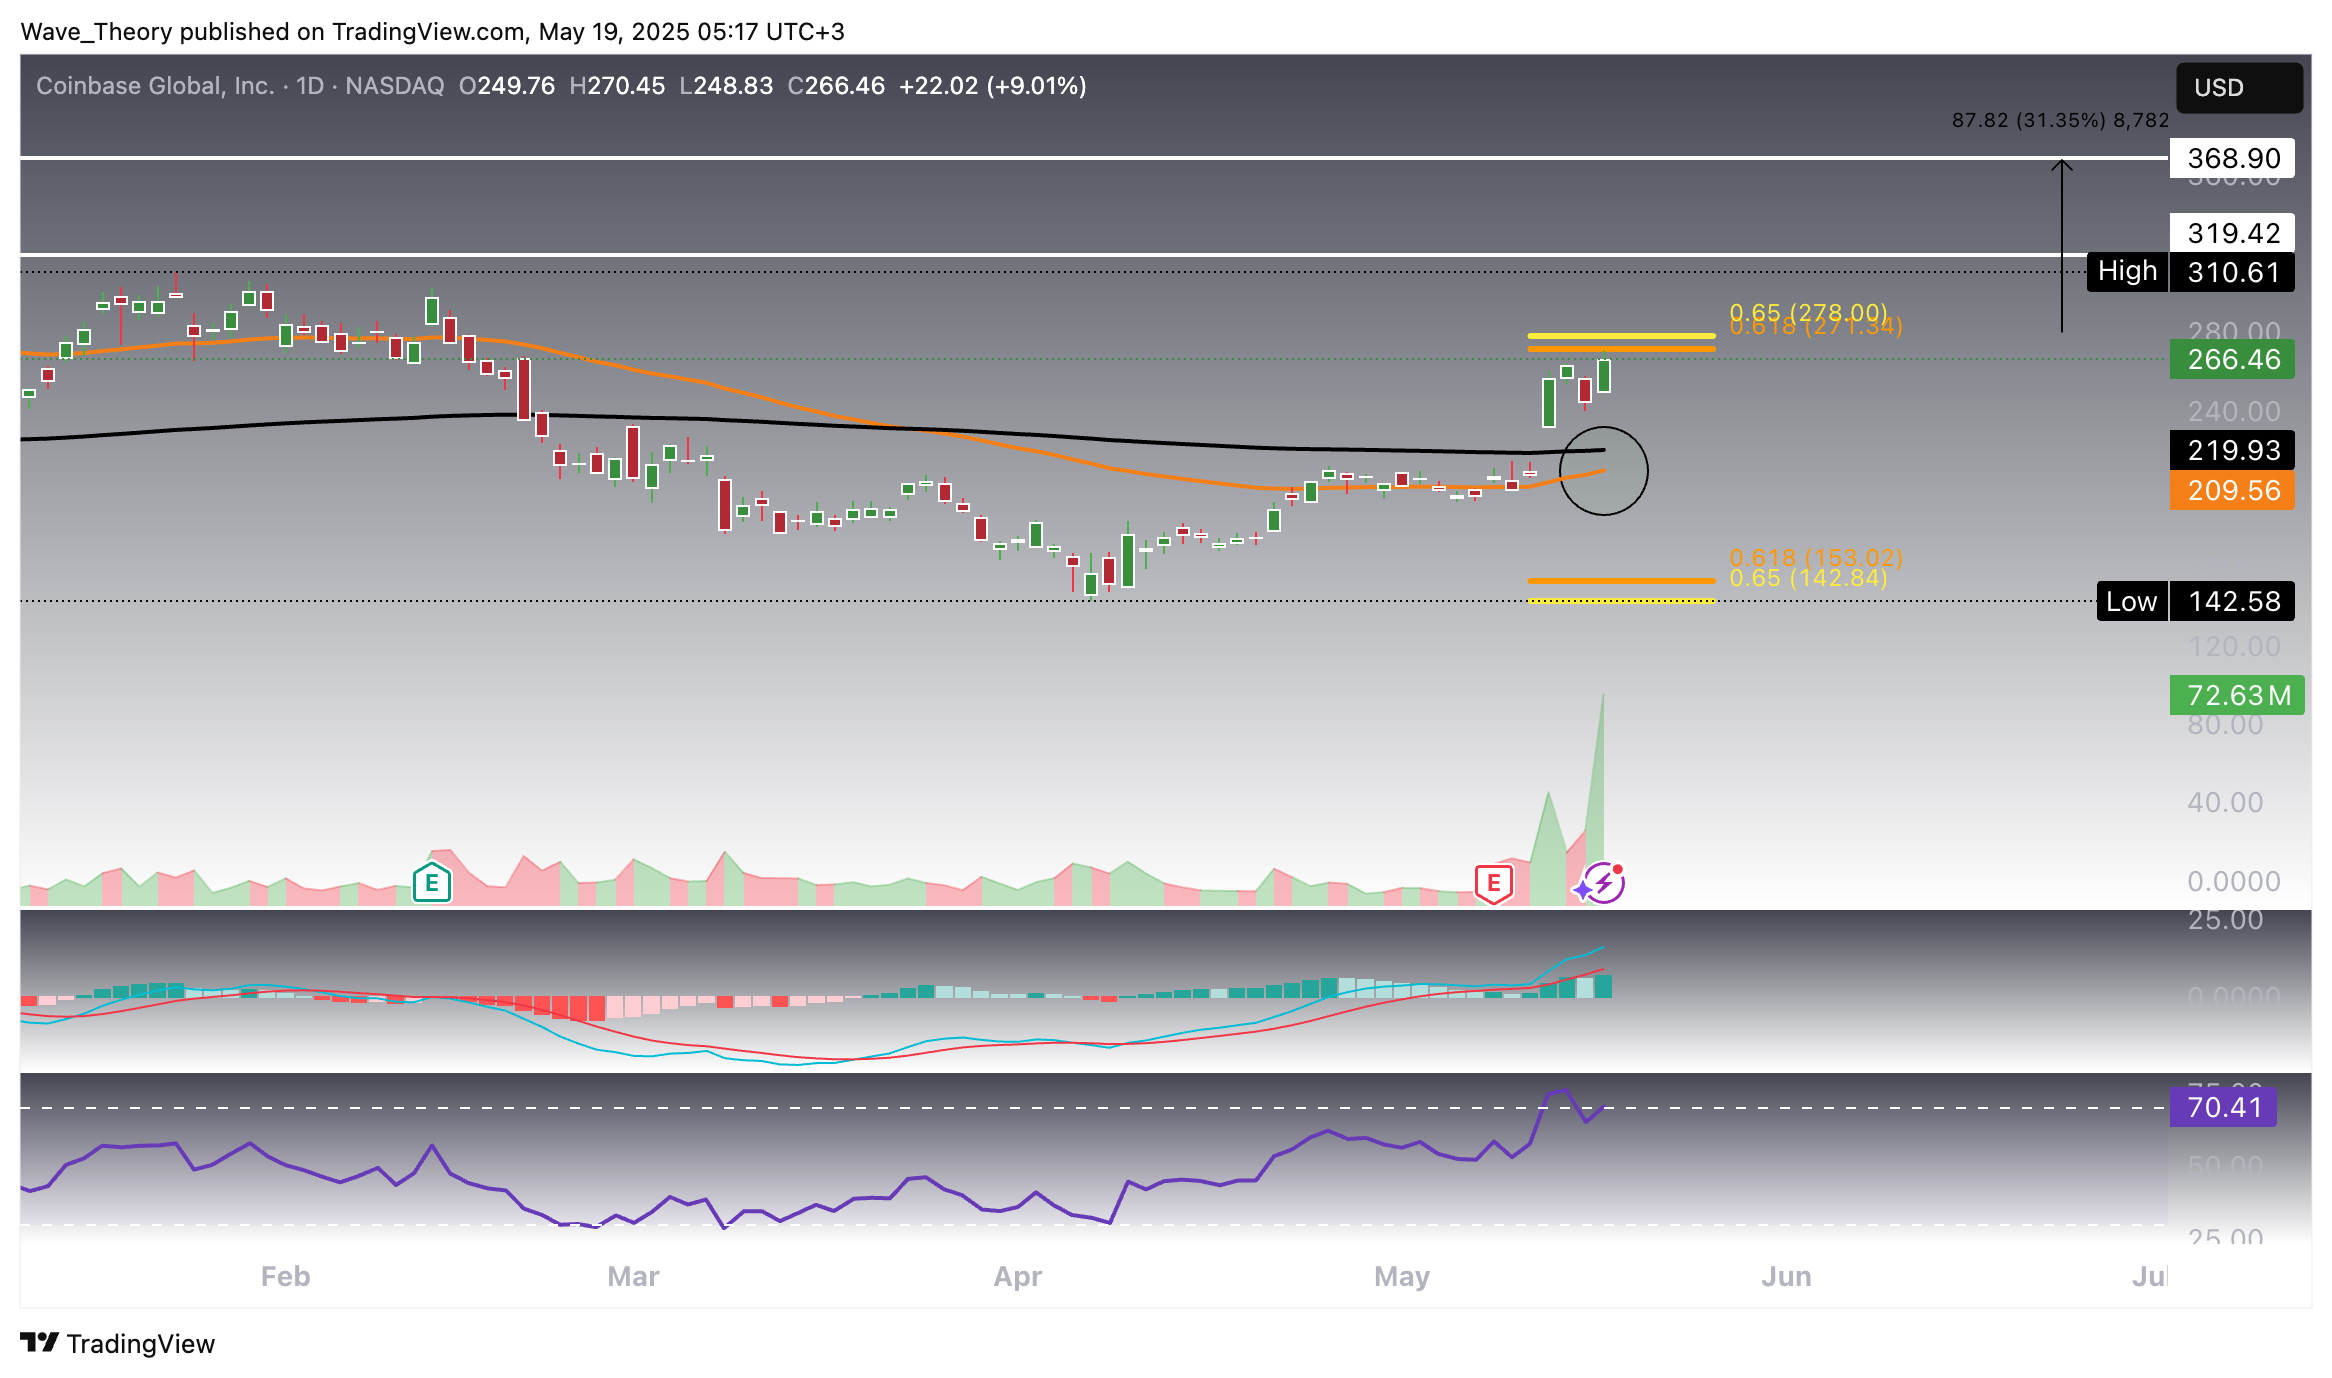
On the daily chart, Coinbase’s MACD lines have already crossed bullishly, with the MACD histogram continuing to tick higher, signaling strong upward momentum. The RSI is approaching overbought territory, suggesting caution but not yet signaling an immediate reversal. Meanwhile, the EMAs are on the verge of forming a golden crossover, which would confirm a sustained bullish trend in the short- to medium-term timeframe.
If Coinbase can decisively break above the key golden ratio resistance at $278, it could potentially rally another 31%, targeting the upper end of the resistance zone between $319 and $370.
Mixed Signals on Coinbase Stock’s 4H Chart
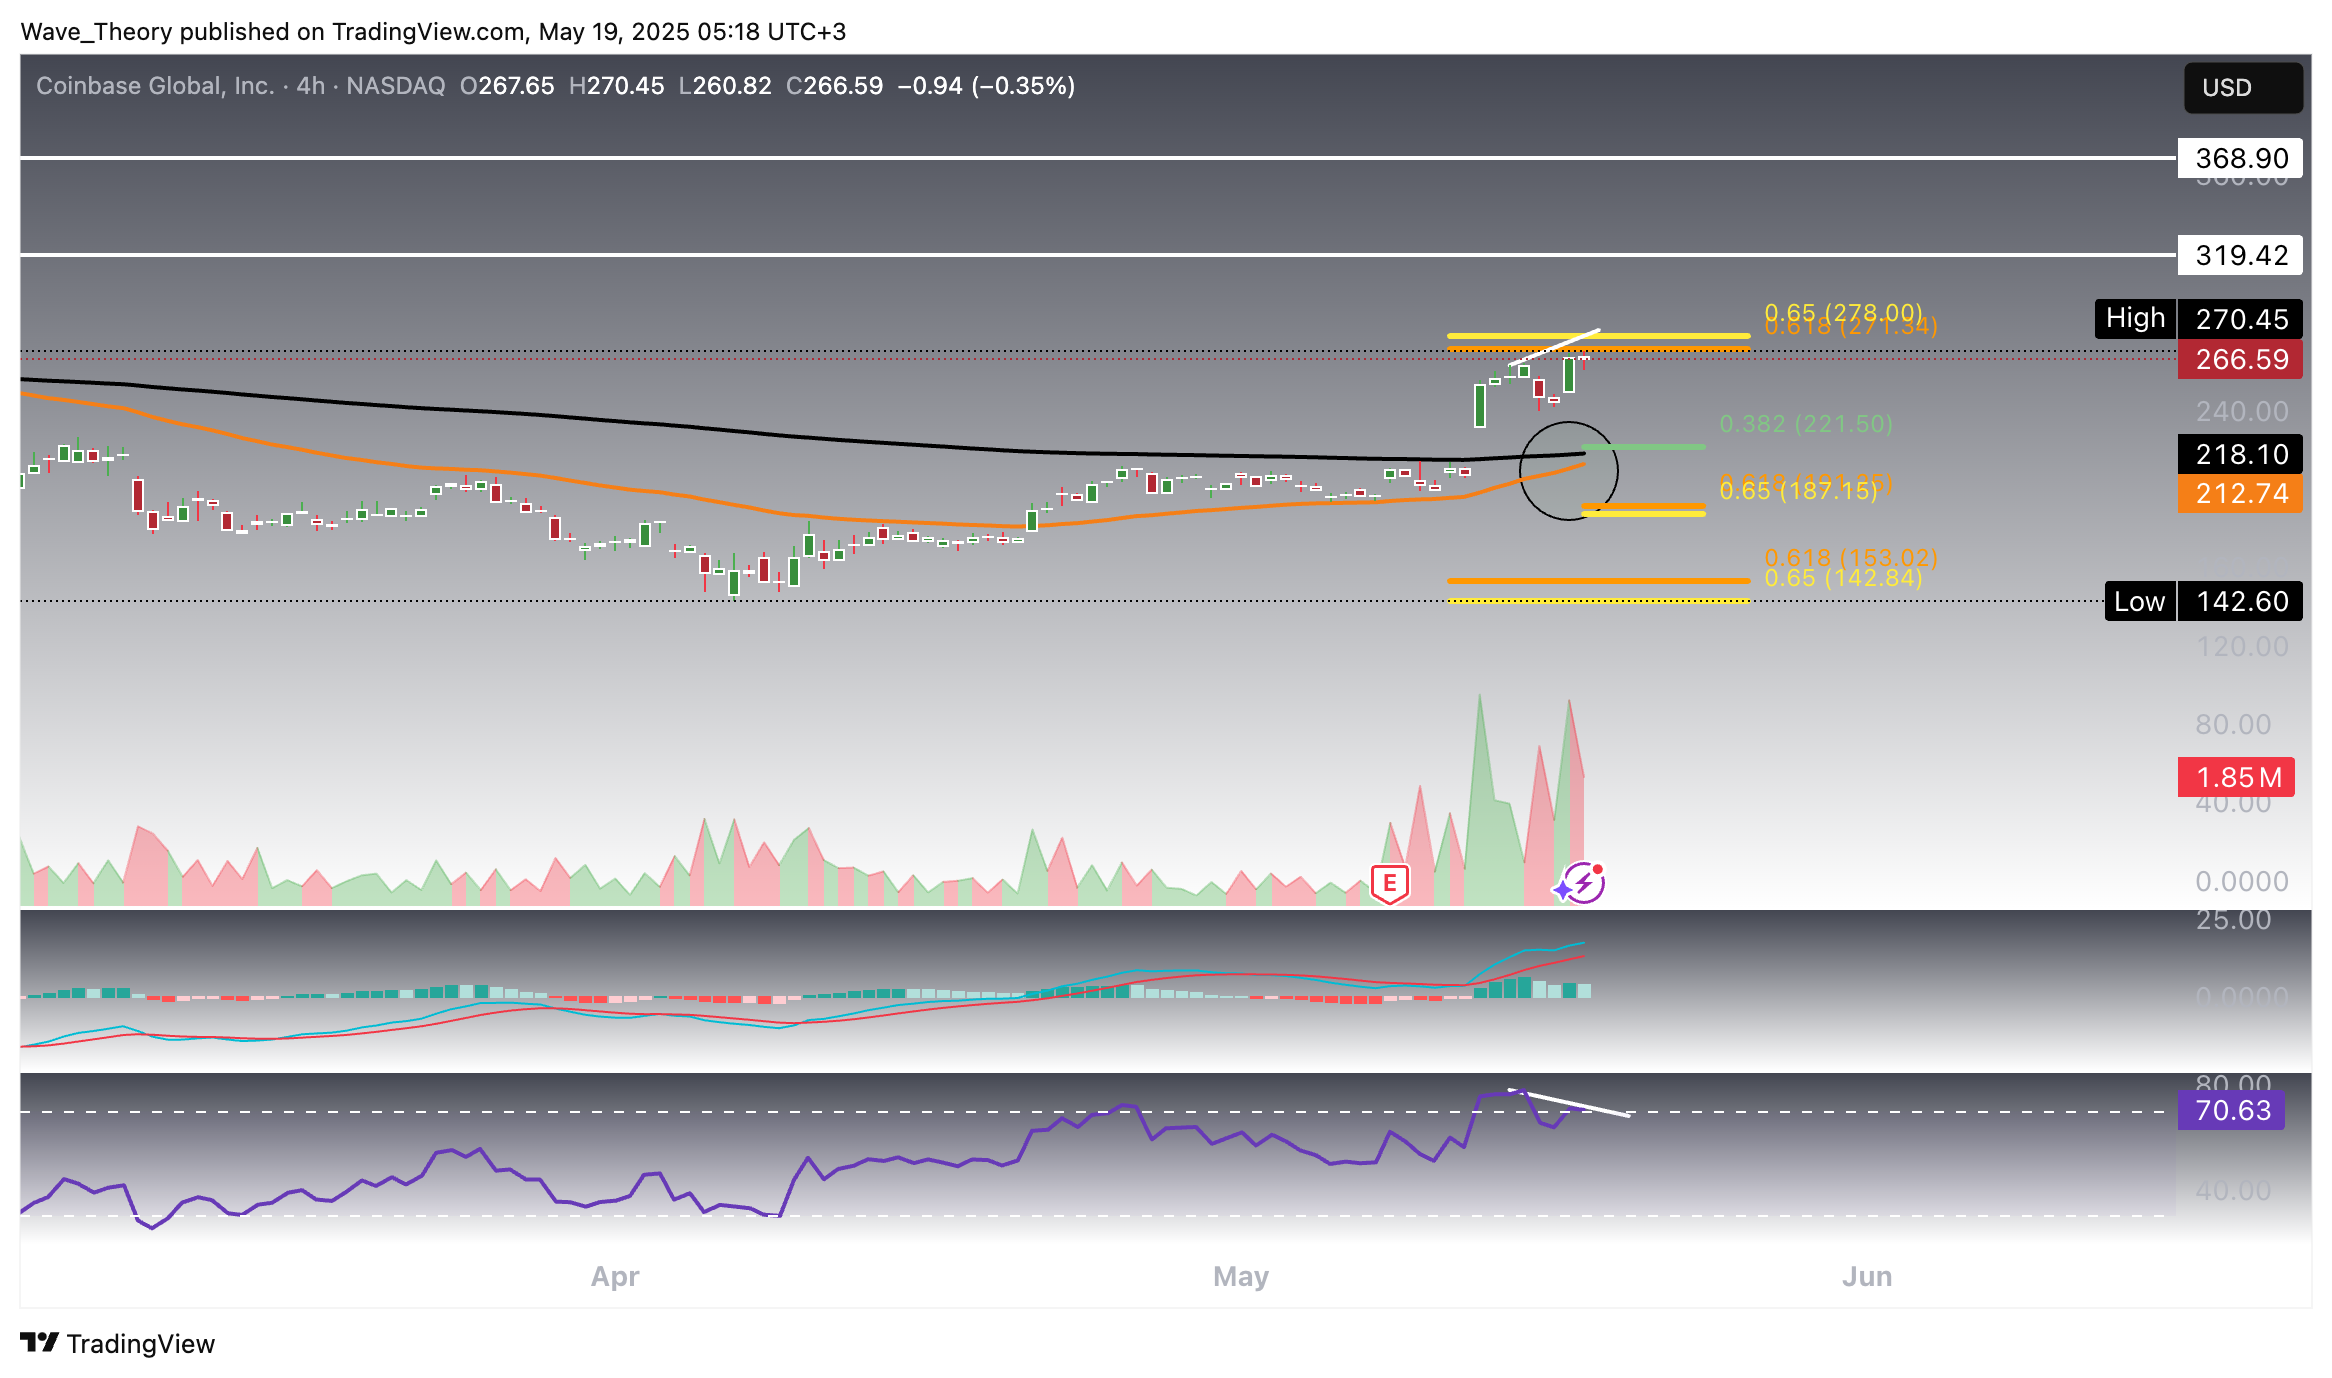
On the 4-hour chart, the MACD lines have crossed bullishly, and the EMAs are poised to form a golden crossover, which would reinforce short-term bullish momentum. However, the MACD histogram has started to tick lower, indicating weakening momentum, while the RSI is showing bearish divergence as the stock approaches the critical golden ratio resistance at $278.
If Coinbase enters a corrective phase, the next significant Fibonacci support levels to watch are at $221.50 and $187, providing potential areas for price stabilization.
Summary
Coinbase (COIN) has bounced off the critical golden ratio support near $145 for the second time, rallying nearly 90% and targeting resistance between $278 and $370. The monthly and weekly charts show predominantly bullish signals, with MACD bullish crossovers and EMA golden crosses supporting mid- to long-term strength, while the daily chart nears a golden crossover and RSI approaches overbought levels. On the shorter 4H timeframe, mixed momentum signals suggest caution near the $278 resistance, with potential corrective supports at $221.50 and $187.
- Check out our free forex signals
- Follow the top economic events on FX Leaders economic calendar
- Trade better, discover more Forex Trading Strategies
- Open a FREE Trading Account
- Read our latest reviews on: Avatrade, Exness, HFM and XM
Related Articles
Sidebar rates
