Bitcoin Holds Above $104K Amid Mixed Sentiment: Analysts Predict Continued Bull Market Despite Near-Term Volatility Risks
Bitcoin (BTC) is still above the psychologically important $104,000 threshold, showing that it is quite strong even though there are growing
Quick overview
- Bitcoin remains strong above the $104,000 mark, currently trading at approximately $104,600 with a 3% increase over the past two weeks.
- Technical analysis indicates a compression pattern, suggesting a potential significant price movement ahead as BTC consolidates between $109,000 and $103,000.
- Despite retail weakness, on-chain data shows institutional strength with whale accumulation, while short-term holders exhibit concerning selling behavior.
- Long-term fractal analysis suggests Bitcoin's bullish phase may continue for several more months, with potential price targets reaching up to $137,000.
Bitcoin BTC/USD is still above the psychologically important $104,000 threshold, showing that it is quite strong even though there are growing worries about where the market is going. According to CoinGecko, BTC is currently trading for roughly $104,600, which is a small 3% increase over the past two weeks.
The cryptocurrency market is at a really interesting point right now. Sentiment indicators show that people are unsure about the market, which hasn’t happened since April’s market crash. Santiment’s most recent survey of social media shows that the mood of retail traders has achieved an unprecedented balance, with only 1.03 bullish remarks for every negative comment on major platforms like Telegram, Discord, Reddit, and X.
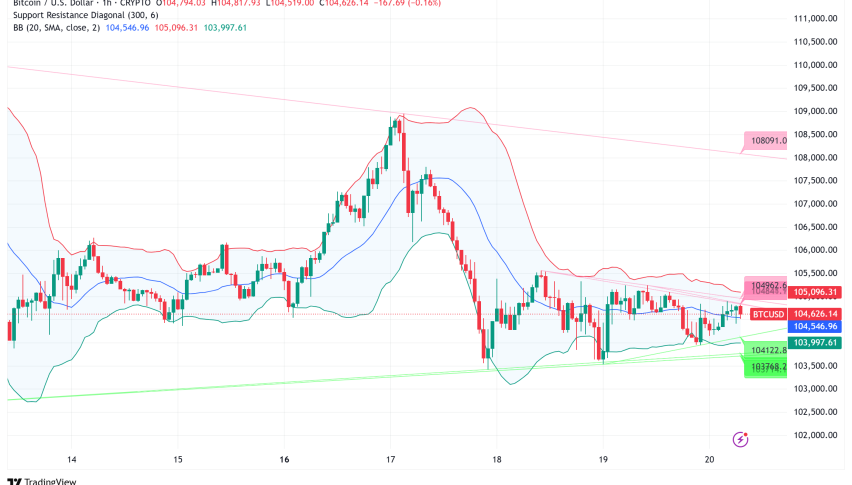
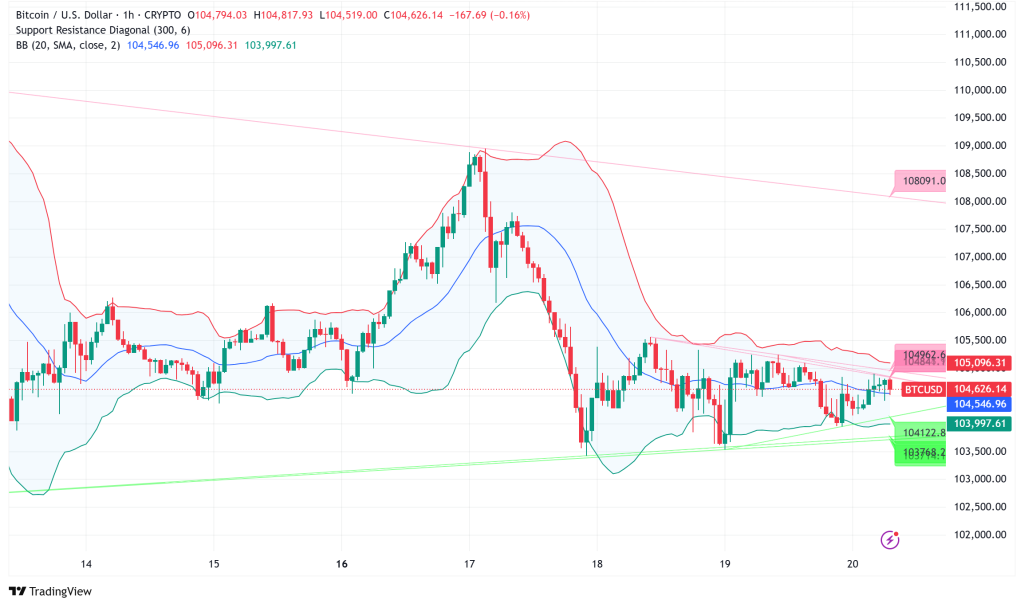
BTC/USD Technical Analysis Reveals Compression Pattern Ahead of Major Breakout
Bitcoin looks like it’s getting ready to make a big move from a technical point of view. Analyst Daan Crypto sees a distinct compression pattern, with BTC trading in a narrow range between a monthly high of $110,600 and a monthly low of roughly $100,000. The most important range to observe is between $109,000 and $103,000. Right now, the price is close to the monthly open.
This phase of consolidation, which tests traders’ patience, usually comes before big price changes. The compression indicates that market players are preparing for the next significant directional shift, with statistics strongly indicating additional displacement within the existing timeframe.
Whale Accumulation Signals Underlying Strength Despite Retail Weakness
Even though things seem ambiguous on the surface, on-chain data tells a strong story about institutional strength. Santiment’s research shows that 231 new wallets have collected more than 10 Bitcoin in the last 10 days. On the other hand, more than 37,000 smaller wallets that contain less than 10 BTC have sold their assets.
This difference between whale accumulation and retail capitulation is a typical sign that has come before bullish momentum in the past. When big investors add to their holdings while small investors lose faith, it generally sets the stage for prices to keep going higher.
But there are certain warning signs in the activity of short-term holders (STHs). According to CryptoQuant, more than 15,000 BTC owned by STHs lost value this week. The most transfers happened on Wednesday, when the price fell from $106,500 to $103,500. This “weak hands” selling conduct is worrying in the short term, but it usually happens during capitulation phases that make it easier for prices to rise.
Seasonal Factors and Federal Reserve Policy Create Headwinds
QCP Capital said that Bitcoin’s volatility could go up in the summer because businesses usually slow down in July and August. The trading desk says that Bitcoin’s implied volatility is currently below 40%, which is proof of this seasonal slowdown.
Also, the Federal Reserve’s hawkish approach continues to make risk assets look bad. The Fed’s “wait and see” strategy generates uncertainty about monetary policy, which could make people less likely to invest in the near future. This is because inflation expectations are still high and tariffs are seen as a major upside risk.
Fractal Analysis Suggests Bull Market Far From Over
Long-term technical analysis shows a positive view, even though there are short-term problems. Titan of Crypto, a market analyst, sees a strong fractal pattern that suggests Bitcoin is still in the expansion phase of its current cycle. When looking at the past, Bitcoin usually goes down for 13 months and then up for 35 months.
The current cycle’s bullish phase started in January 2023 and is now in its 29th month. This means that the market might go up for five more months before making any big changes. Bitcoin has followed this trend through past cycles, and the cryptocurrency has gone up 530% since the current bullish phase began.
Bitcoin Price Predictions and Support Levels
Technical analysis indicates various possibilities for Bitcoin’s imminent path:
- Bullish Case: If the fractal pattern holds, Bitcoin could reach approximately $137,000 before any serious correction, with some analysts like Samson Mow projecting eventual targets above $1 million driven by institutional adoption and sovereign demand.
- Conservative Projection: CoinCodex forecasts a 5.73% climb to roughly $110,732 by July 19, 2025, based on current technical indicators showing neutral sentiment.
- Bearish Scenario: Should short-term selling pressure intensify, on-chain cost-basis analysis identifies support between $97,000 and $94,000, representing potential local bottom levels that could sweep liquidations under $100,000.
- Check out our free forex signals
- Follow the top economic events on FX Leaders economic calendar
- Trade better, discover more Forex Trading Strategies
- Open a FREE Trading Account
- Read our latest reviews on: Avatrade, Exness, HFM and XM
Related Articles


Sidebar rates
Related Posts
