Nvidia (NVDA) Stock Bullish Breakthrough— Eyes Set on New All-Time High
Quick overview
- Nvidia (NVDA) has surged nearly 70% since April, breaking through key resistance levels and signaling a potential retest of its all-time high.
- Despite bullish momentum, technical indicators show mixed signals, with signs of bearish divergence emerging on the daily chart.
- Immediate support is established at $141, while further downside could test levels around $121.30 and $94.70 if breached.
- The overall technical structure remains bullish, but caution is advised due to early signs of momentum cooling.
Nvidia (NVDA) is powering through a key golden ratio resistance level, signaling the end of its recent correction phase. With bullish momentum accelerating, the stock now appears poised to retest its previous all-time high — or potentially chart new record territory.
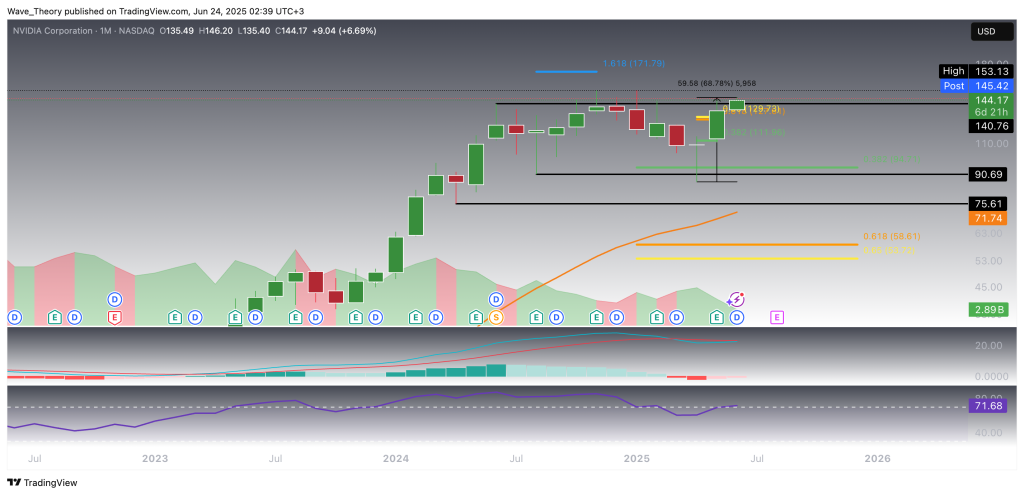
Nvidia (NVDA) Has Surged Nearly 70% Since April, Breaks Key Resistance Levels
Since the beginning of April, Nvidia (NVDA) has rallied by over 68%, staging a powerful rebound from the critical support zone between $75 and $91. This bullish momentum has propelled the stock decisively through two major resistance levels: first the golden ratio resistance at $129, followed by a clean breakout above the $141 level — both of which previously capped upward price action.
With these barriers cleared, Nvidia is now positioned to reclaim its all-time high (ATH) at $153, with a potential extension toward a new ATH around $172, based on Fibonacci projection levels.
From a momentum perspective, the monthly MACD lines remain bearishly crossed, but a constructive shift is underway: the MACD histogram has been ticking bullishly higher since last month, indicating a possible bullish crossover in the coming weeks if momentum persists. Simultaneously, the RSI is approaching overbought territory, yet has not triggered any bearish divergence or reversal signal — supporting the continued strength of the current uptrend.
In summary, NVDA’s technical structure has turned decisively bullish in the mid- to long-term, with momentum and price action both favoring a retest of previous highs — and potentially, price discovery above $170 in the sessions to come.
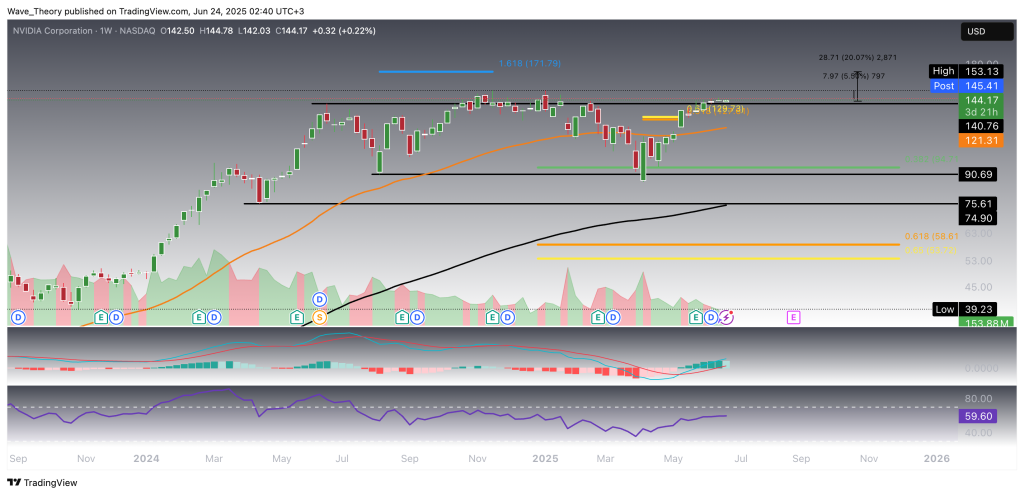
What Is the Immediate Upside for Nvidia (NVDA) Stock?
On the weekly chart, Nvidia (NVDA) continues to exhibit a constructively bullish structure. Both the MACD lines and EMAs remain in a bullish crossover, confirming a sustained upward trend in the mid-term. The RSI is currently hovering in neutral territory, suggesting there is room for further upside without being technically overbought. However, the MACD histogram has started to tick lower this week, indicating a possible short-term loss of momentum.
Should a near-term correction unfold, NVDA has a robust support framework below current levels. The 50-week EMA at $121.30 serves as immediate support. A break below this level could open the path toward the 0.382 Fibonacci retracement at $94.70, which marks a significant structural support level. Further below, the 200-week EMA near $75 aligns with the lower bound of the historical support zone between $75 and $91, reinforcing its importance as a long-term floor.
On the upside, if Nvidia maintains its bullish trajectory, it faces 6% to 20% additional upside before encountering major resistance zones — with potential targets aligned with the previous ATH at $153 and projected Fibonacci extensions near $172.
In short, while momentum is showing early signs of cooling, the technical trend remains intact. The path of least resistance remains higher unless key support levels are breached.
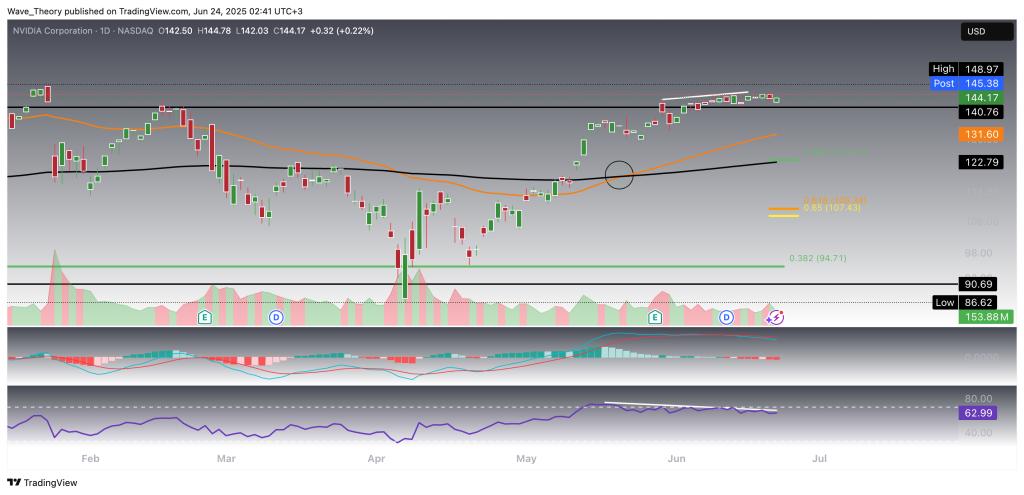
Bearish Divergence Emerges Despite Golden Crossover on Nvidia’s Daily Chart
On the daily chart, Nvidia (NVDA) presents a technically mixed outlook. The EMAs have recently formed a golden crossover, confirming a bullish trend in the short- to medium-term. However, momentum indicators are flashing early signs of weakness.
Notably, the RSI is now showing a bearish divergence, suggesting that despite higher price highs, buying momentum is waning. In parallel, the MACD lines have crossed bearishly, and the MACD histogram continues to tick lower, reinforcing the short-term risk of a correction.
That said, NVDA is currently holding above initial support at the previously broken resistance level of $141, which now serves as a potential springboard. Should this level give way, further Fibonacci support levels are located at $123.40 and $108, offering key zones where buyers could re-enter the market.
In summary, while the golden crossover confirms a constructive trend, bearish divergence in momentum indicators warrants caution in the near term. A break below $141 could signal a broader pullback, while holding above it may allow bulls to regain control.
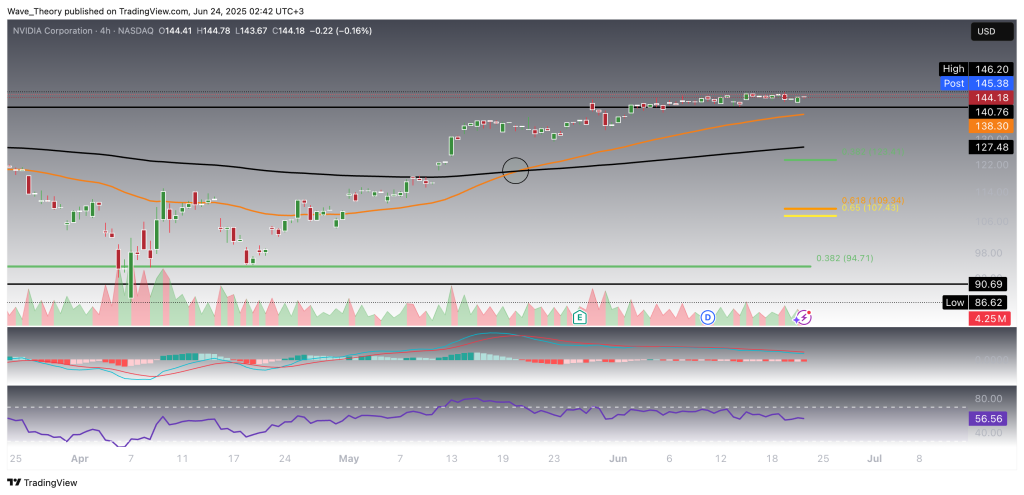
More Mixed Signals on Nvidia’s 4H Chart
The 4-hour chart of Nvidia (NVDA) further reinforces the presence of conflicting technical signals. While the EMAs have formed a golden crossover, typically a bullish confirmation of short-term trend strength, momentum indicators are not in alignment.
The MACD lines remain bearishly crossed, and the MACD histogram continues to tick lower, indicating ongoing short-term bearish pressure. Meanwhile, the RSI oscillates within neutral territory, providing no clear directional bias.
This divergence between trend confirmation (via EMAs) and momentum deterioration (via MACD) suggests that NVDA may be entering a consolidation or corrective phase, pending a more decisive move in either direction.
- Check out our free forex signals
- Follow the top economic events on FX Leaders economic calendar
- Trade better, discover more Forex Trading Strategies
- Open a FREE Trading Account
- Read our latest reviews on: Avatrade, Exness, HFM and XM
Related Articles

Sidebar rates
Related Posts
