Robinhood (HOOD) Stock Surges 240 % After Sharp Bounce At Golden Ratio Support

Quick overview
- Robinhood (HOOD) stock has surged over 240% in the past 14 weeks, now trading above $100 after rebounding from a key support level.
- The company's initiative to tokenize stocks and ETFs has driven investor interest but faced backlash from major companies distancing themselves from these assets.
- Technical indicators suggest a bullish outlook for HOOD, with strong momentum and a new all-time high at $100.88, despite potential short-term correction risks.
- The 4-hour chart shows mixed signals, indicating waning bullish momentum, but the overall trend remains intact for now.
Robinhood (HOOD) stock has surged over 240% in the past 14 weeks, rebounding strongly off the key Golden Ratio support level at $30. Now trading above the $100 mark, the question is: does HOOD have more room to run?
Robinhood’s Tokenization Push Fuels Rally — But Not Without Backlash
Robinhood’s recent rally has been partly driven by its bold initiative to tokenize stocks and ETFs, a move that positions the platform at the forefront of bridging traditional finance with blockchain-based assets. This development has captured investor attention, contributing to the stock’s explosive upside.
However, the initiative has not been without controversy. Several major companies — including OpenAI — have publicly distanced themselves from the tokenized versions of their shares, clarifying that these blockchain-based assets do not represent actual equity and are not affiliated with them in any official capacity. This backlash highlights the regulatory and reputational complexities of tokenizing real-world securities, and could pose short-term risks if clarity isn’t established.
Robinhood Sets New All-Time High at $100.88
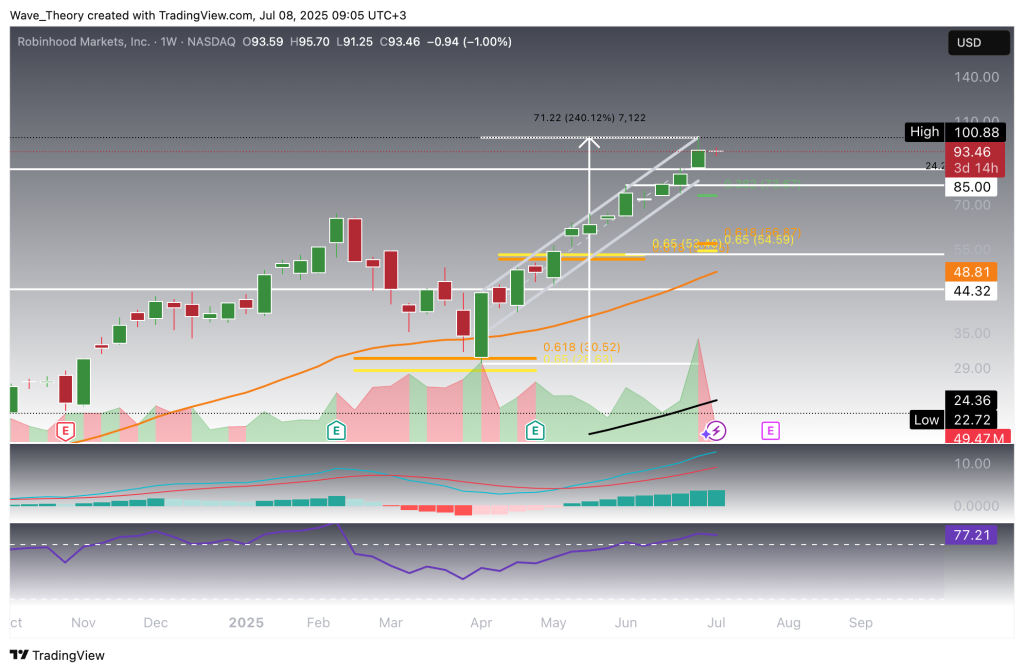
Robinhood (HOOD) has broken above its previous all-time high, setting a new peak at $100.88. This move marks a staggering gain of over 240% in just 14 weeks, following a textbook rebound from the key Golden Ratio support level at $30. From a technical perspective, the long-term outlook remains strongly bullish. On the weekly chart, the exponential moving averages (EMAs) have formed a golden crossover — a classic bullish continuation signal — reinforcing the strength of the prevailing uptrend.
Momentum indicators support this narrative: the MACD histogram continues to print higher bullish bars, while the MACD lines remain in a firm bullish crossover. Although the Relative Strength Index (RSI) is now situated in overbought territory, it has yet to flash any signs of bearish divergence or reversal, indicating that momentum remains intact. All considered, HOOD’s technical structure suggests that further upside may still be on the table, despite the sharp rally already in place.
Robinhood
More Bullish Signals on the Monthly Chart
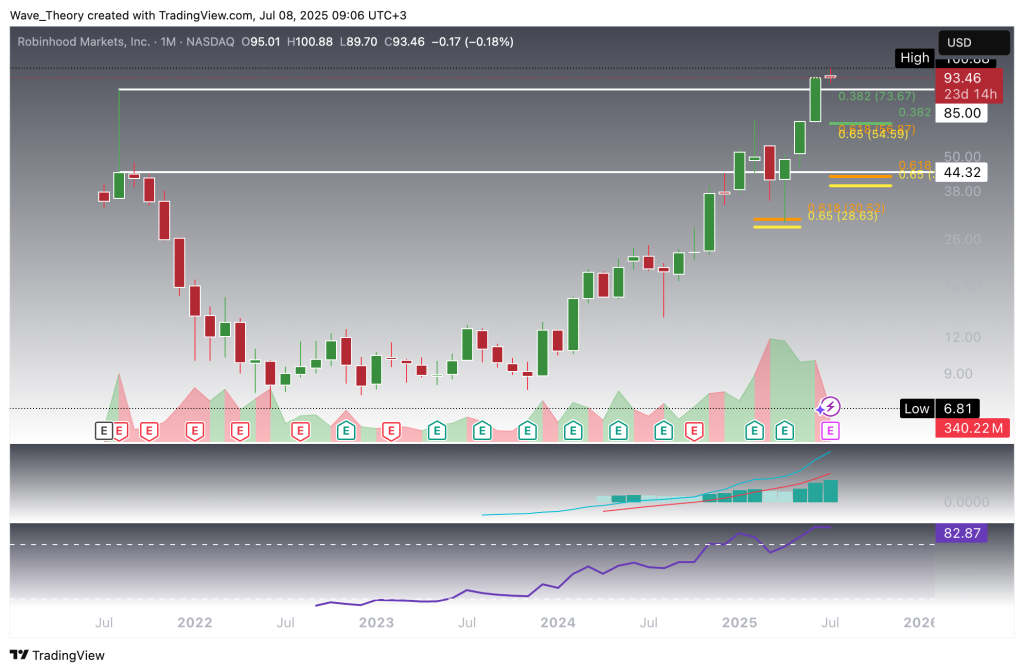
The monthly chart continues to reinforce the bullish narrative for Robinhood. The MACD histogram has been ticking higher for three consecutive months, accompanied by a sustained bullish crossover of the MACD lines — a sign of strengthening upward momentum. The RSI has now entered extreme overbought territory, yet notably, it has not developed any bearish divergence — suggesting that momentum remains intact.
Zooming out, Robinhood’s long-term trajectory has been nothing short of remarkable. Over the past three years, the stock has rallied from a low of $6.81 to above the $100 mark, underscoring the strength of the current uptrend and the long-term bullish structure.
Potential Correction Targets
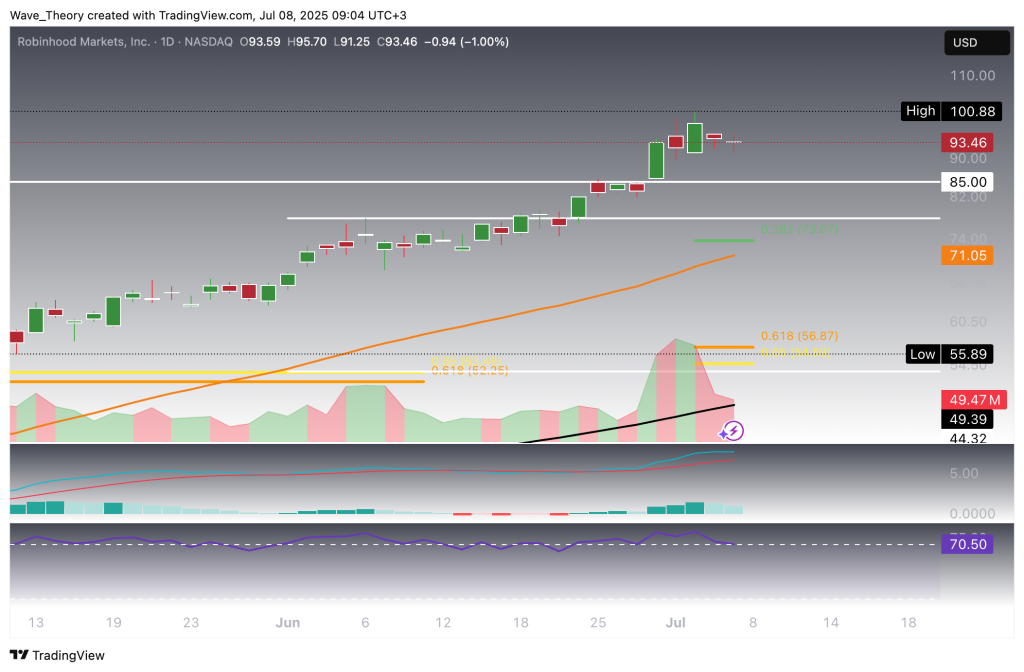
In the event of a correction, Robinhood may find initial support within the $78–$85 zone, which served as a consolidation area during its recent rally. Below that, significant Fibonacci retracement support is located at $74 and $56, offering potential levels for a healthy pullback. The 50-day EMA, currently sitting at $71, adds further confluence as dynamic support in the short term.
Despite the possibility of a correction, the broader technical outlook remains constructive. The EMAs and MACD lines continue to show bullish crossovers, affirming a positive trend in the short- to medium-term. The RSI, while retreating from overbought levels, is now approaching neutral territory — a potential reset without signaling weakness.
However, some caution is warranted: the MACD histogram has begun ticking lower since yesterday, reflecting a minor loss in bullish momentum. While not a decisive bearish signal on its own, it suggests that a near-term consolidation or pullback could be on the horizon.
Robinhood
Mixed Signals on the 4H Chart
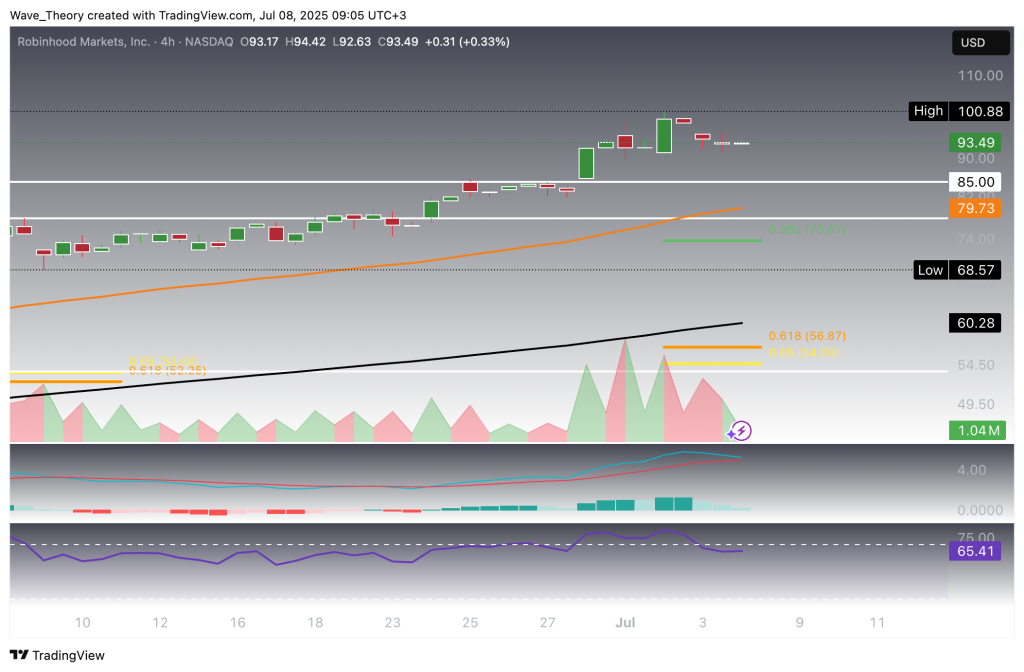
The 4-hour chart for Robinhood presents a mixed technical picture. The MACD histogram has been ticking lower in recent sessions, suggesting waning bullish momentum and raising the possibility of a bearish crossover in the MACD lines. At the same time, the RSI is drifting in neutral territory, offering no clear directional bias at the moment.
However, the short-term trend remains intact for now, as the EMAs continue to display a golden crossover — a signal that typically supports a bullish outlook in the near term. Overall, while early signs of weakness are emerging, confirmation of a trend reversal has yet to materialize.
- Check out our free forex signals
- Follow the top economic events on FX Leaders economic calendar
- Trade better, discover more Forex Trading Strategies
- Open a FREE Trading Account
- Read our latest reviews on: Avatrade, Exness, HFM and XM
Related Articles


Sidebar rates
Related Posts
