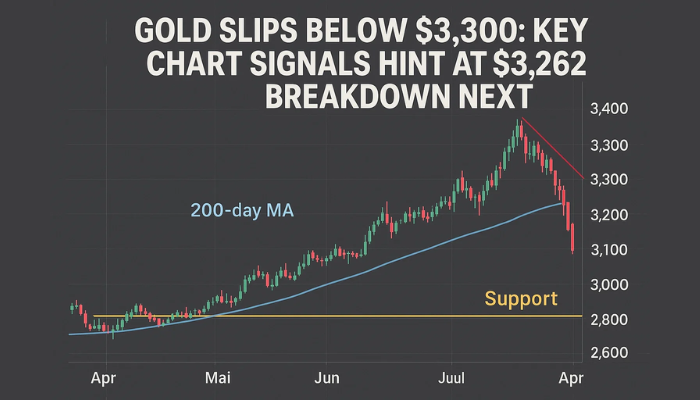
Gold Slips Below $3,300: Key Chart Signals Hint at $3,262 Breakdown Next
Gold (XAU/USD) is trading with a bearish tilt on Wednesday, sliding back under the $3,300 handle in the Asian session.
Quick overview
- Gold (XAU/USD) is experiencing a bearish trend, currently trading around $3,295 due to the Federal Reserve's hawkish stance and U.S. tariff concerns.
- The market anticipates the Fed will maintain steady rates, which is driving Treasury yields and the U.S. Dollar higher, negatively impacting gold prices.
- Technical analysis shows a bearish breakdown, with resistance now at $3,307–$3,321 and a potential short entry if gold retests this zone.
- With FOMC minutes expected to influence market sentiment, traders should remain cautious and wait for confirmation before making moves.
Gold (XAU/USD) is trading with a bearish tilt on Wednesday, sliding back under the $3,300 handle in the Asian session. As of writing, gold hovers near $3,295, facing pressure from two key fronts: the Federal Reserve’s hawkish stance and renewed U.S. tariff fears that are keeping broader risk sentiment fragile.
From a macro view, the market’s growing belief that the Fed will hold rates steady through the summer, especially amid Trump’s tariff-driven inflation risks, is pushing Treasury yields and the U.S. Dollar higher. Naturally, that weighs on gold, which doesn’t pay interest.
At the same time, equity markets remain uneasy following Trump’s pledge to implement 200% tariffs on foreign drugs and 50% on copper starting August 1. In theory, rising geopolitical stress should support gold as a safe haven, but in reality, traders seem hesitant to jump in aggressively ahead of today’s FOMC minutes. That report could reshape rate-cut bets and the near-term outlook for both USD and XAU/USD.
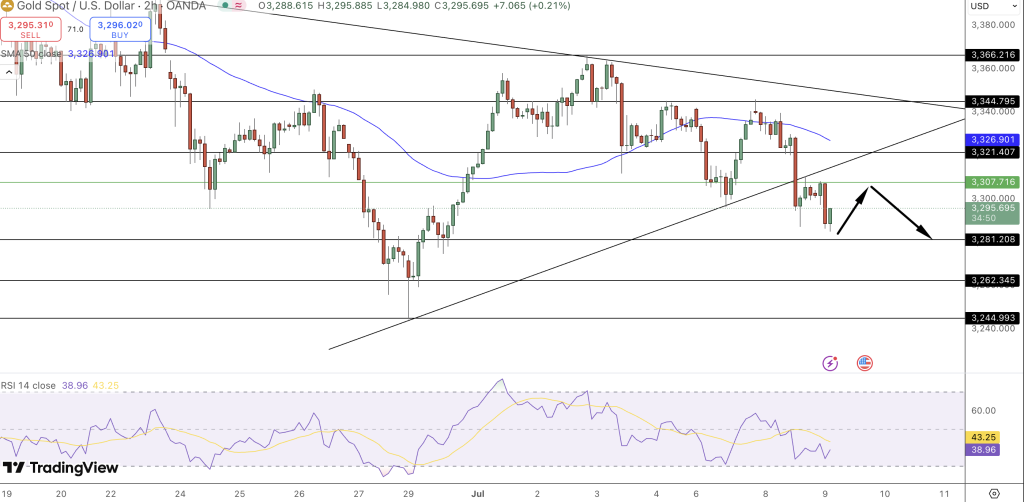
Bearish Breakdown Confirmed on the Chart Above
Now, if you look at the chart above, it’s clear gold has lost steam. After forming a symmetrical triangle over the past few weeks, price action recently broke below the ascending trendline and failed to recover above the 50-SMA (near $3,326 on the 2-hour timeframe).
What I often see—and this chart is a textbook example—is when price retests broken support and fails to reclaim it, it usually signals deeper downside ahead. In this case, $3,307–$3,321 has flipped into resistance. A bearish engulfing candle just below that zone confirms sellers are still in control.
Momentum isn’t helping the bulls either. The 14-period RSI is stuck around 39 and diverging from price, indicating weakness despite minor rallies. There’s no sign of bullish reversal structures like Morning Stars or Three White Soldiers. Instead, we’re getting lower highs, long upper wicks, and rejection candles, classic signs of bearish continuation.
Trade Idea: Bearish Retest Toward $3,262 Support
Here’s a setup I’d personally watch: If gold retests the $3,307–$3,321 zone and gives us a rejection pattern (like a shooting star or bearish engulfing), it’s a clean short entry.
Trade Plan:
- Entry: On rejection near $3,307–$3,321
- Stop-loss: Above $3,326 (above the 50-SMA)
- Target 1: $3,281 support
- Target 2: $3,262 (next key demand zone)
In my experience, when RSI stays weak and dynamic resistance (like the 50-SMA) keeps holding, the momentum trade is usually the right one. No need to predict tops—just respond to price behavior.
With FOMC minutes due later today, expect volatility. If sentiment remains hawkish, gold could see another leg lower. As always, wait for confirmation—price action leads, not forecasts.
- Check out our free forex signals
- Follow the top economic events on FX Leaders economic calendar
- Trade better, discover more Forex Trading Strategies
- Open a FREE Trading Account
- Read our latest reviews on: Avatrade, Exness, HFM and XM
Related Articles


Sidebar rates
Related Posts
