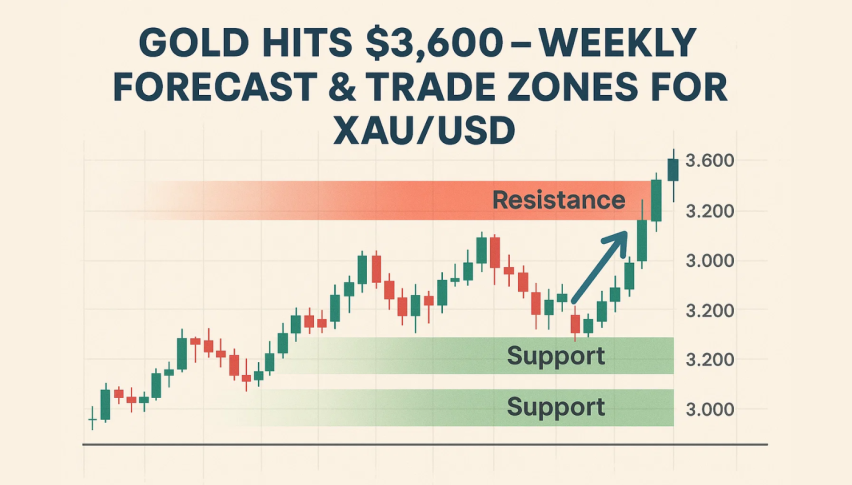
Gold Hits $3,600 – Weekly Forecast & Trade Zones for XAU/USD
Gold (XAU/USD) surged about 1.8%, driven by a weaker U.S. dollar and rising bets on a Federal Reserve rate cut...
Quick overview
- Gold (XAU/USD) rose 1.8% due to a weaker U.S. dollar and expectations of a Federal Reserve rate cut.
- The latest Nonfarm Payrolls report showed disappointing job growth and an increase in unemployment to 4.2%, indicating a softening labor market.
- Gold is testing the $3,600 resistance level, with bullish indicators suggesting potential upward momentum if broken.
- Conversely, a rejection at $3,600 could lead to a pullback towards $3,545 or $3,530, presenting a buy-on-dip opportunity.
Gold (XAU/USD) surged about 1.8%, driven by a weaker U.S. dollar and rising bets on a Federal Reserve rate cut. The recent Nonfarm Payrolls report surprised on the downside—jobs added were well below forecasts, and unemployment ticked up to 4.2%, the highest since November 2021. Wages were stable at 3.6% year-over-year, reinforcing the narrative of a softening labor market.
That combo—softer inflation signals, Fed easing expectations, and a sliding dollar—sent investors flocking to safe havens. Gold, long-held by central banks and traders alike, pulled ahead. It’s not just reactionary: global uncertainty and the Fed’s dovish tone keep the metal in the spotlight.
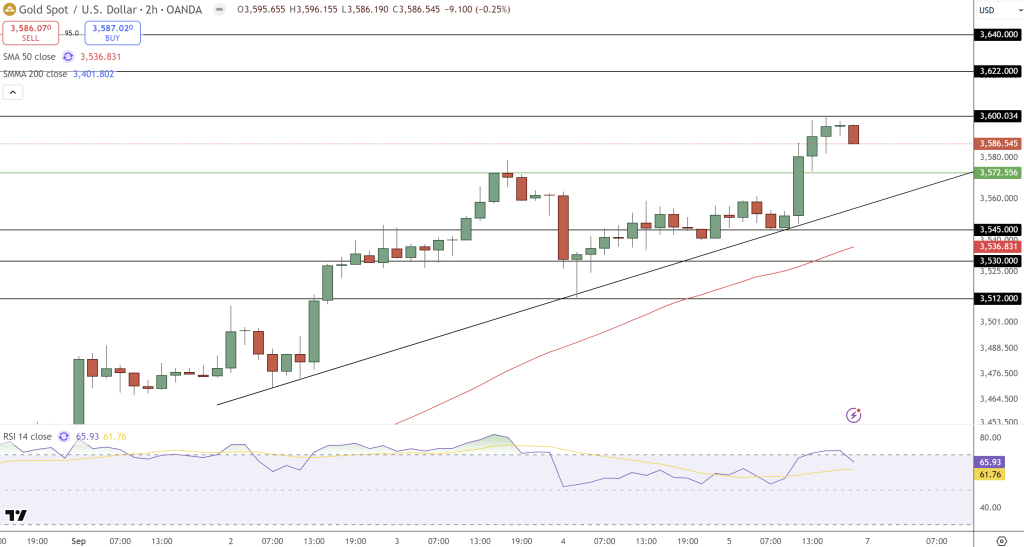
Gold (XAU/USD) Chart Vibes & Key Levels
Gold’s looking solid on the chart. It’s now testing the $3,600 resistance after climbing steadily from $3,545, tracing an ascending trendline that confirms buyers are stepping in at higher lows.
🚨🪙🇺🇸 BREAKING: GOLD hits an ALL-TIME HIGH at $3,600/oz
📈 Safe-haven demand surging globally 🌍 pic.twitter.com/ROaFUJgMYC
— GlobalStatsX (@GlobalStatsXX) September 6, 2025
- Stayed above the 50-SMA (~$3,536)—short-term trend still bullish.
- The 200-SMA (~$3,401) remains firm support, anchoring the bigger picture.
- The latest candlestick—a Doji followed by a red bar—signals hesitation near the ceiling.
- RSI is up near 66, nearing overbought, though no clear divergence (yet) to warn of a sharp reversal.
That said, the candle sequence looks a bit like three white soldiers, suggesting follow-through buying, though spinning tops and a possible shooting star near resistance hint bulls might be running out of steam.
Weekly Outlook & Trade Playbook
Here’s the simple breakdown:
If Gold Breaks Above $3,600
Expect momentum to flow toward $3,622 and possibly $3,640. A volume-backed bullish engulfing candle would be your green light. Conservative bulls can place a stop just below $3,572 (or tighter at $3,560) for safety.
If Gold Rejects $3,600
Watch for two to three strong bearish candles. A pullback might drop toward $3,545 or even $3,530—good zones for a buy-on-dip setup.
Quick Bullet Summary
- Bullish case: Close above $3,600 could fuel a run toward $3,640.
- Bearish case: Rejection creates correction risk to $3,545–$3,530.
- Indicators: RSI rising but not extreme, Doji + red bar show near-term caution.
- Trend support: 50-SMA and ascending line still intact—guardrails for bullish setups.
- Check out our free forex signals
- Follow the top economic events on FX Leaders economic calendar
- Trade better, discover more Forex Trading Strategies
- Open a FREE Trading Account
- Read our latest reviews on: Avatrade, Exness, HFM and XM
Related Articles


Sidebar rates
Related Posts
