Gold Price Forecast: Bulls Eye $4,100 as Buyers Defend Key Channel Support
Gold (XAU/USD) is taking a breather after last week’s record high, sitting around $3,966 as buyers defend mid-channel support...
Quick overview
- Gold (XAU/USD) is currently consolidating around $3,966 after reaching a record high of $4,057, indicating a temporary pullback rather than a reversal.
- Key support levels include the 38.2% Fibonacci at $3,966 and the 100-SMA at $3,849, while resistance is noted at the 50-SMA at $3,991.
- Recent candlestick patterns and an RSI of 40 suggest that selling pressure is fading, indicating a potential for upward momentum.
- The $3,940-$3,950 area is identified as a buy zone, with bullish sentiment prevailing as long as gold remains above $3,910.
Gold (XAU/USD) is taking a breather after last week’s record high, sitting around $3,966 as buyers defend mid-channel support in a defined uptrend. After hitting a swing high of $4,057, price action has softened, making lower highs on shorter timeframes – not a reversal but a cooling off.
The pullback is right on the 38.2% Fibonacci level at $3,966, a area where traders look for trend continuation. Above, the 50-SMA at $3,991 is resistance, while the 100-SMA at $3,849 is dynamic long-term support. Together, these levels form a strong base that says buyers are in control even if they’re taking a pause.
The bigger picture is still up, as long as gold holds above $3,910 – the channel’s lower boundary and a key psychological level – the setup is accumulation on dips not selling.
Gold Candlestick and RSI Signal Pause, Not Panic
Recent candlestick patterns show hesitation not fear. A cluster of spinning tops and smaller candles at $3,960 is indecision among traders. But no strong bearish reversal pattern like three black crows or bearish engulfing.
Momentum indicators agree. RSI is at 40, near oversold, and sellers might be running out of steam. Historically, rebounds happen when RSI gets to these levels, especially in strong trends.
Technical Highlights:
- 38.2% Fibonacci at $3,966
- 50-SMA at $3,991 resistance
- 100-SMA at $3,849 support
- RSI at 40, momentum could turn up soon
This confluence of support zones and fading selling pressure is a controlled pullback not a breakdown – a classic pause before the next move up.
Gold Trade Setup: Dips Look Buyable
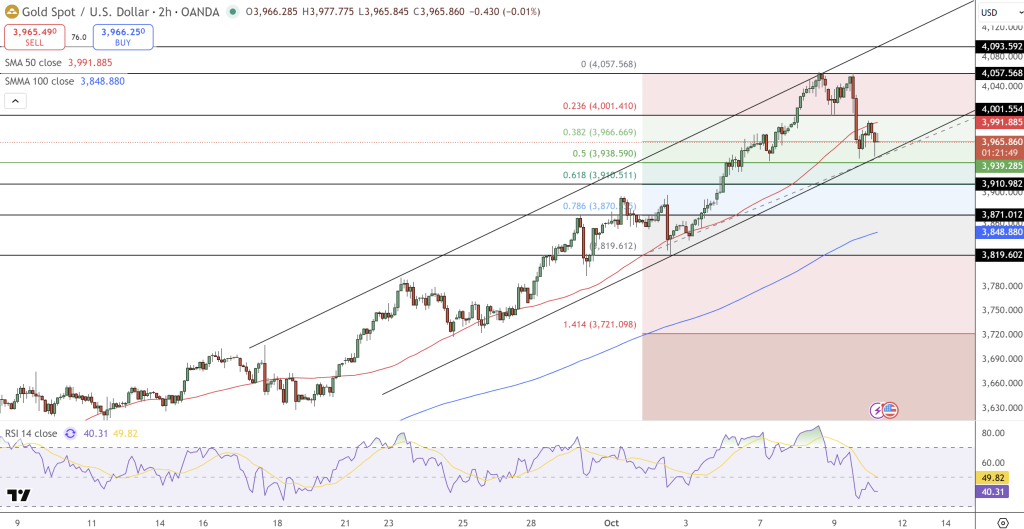
For those waiting for gold’s next move, the $3,940-$3,950 area looks like a re-entry zone. A bounce from here could take out $4,001, then $4,057 – the previous high. Above $4,057 a close would open the way to $4,100.
Below $3,910 would invalidate the short-term setup and could trigger a correction to the 100-SMA at $3,849.
But the balance of evidence is still in favor of the bulls. Gold is in a healthy consolidation within its long-term channel and the technicals say the pullback is just resetting momentum.
For now, any dip below $3,950 looks like an opportunity not a warning – especially as traders prepare for the next move to $4,100 and beyond.
- Check out our free forex signals
- Follow the top economic events on FX Leaders economic calendar
- Trade better, discover more Forex Trading Strategies
- Open a FREE Trading Account
- Read our latest reviews on: Avatrade, Exness, HFM and XM
Related Articles


Sidebar rates
Related Posts
