ADA, which is the native currency of the blockchain Cardano, was launched in 2015, and initially, it traded pretty low, at around $ 0.0007 cents, until early November 2017, when the “Gold Rush” for cryptocurrencies sent them surging higher. The digital currencies, which were priced very low, like ADA, absolutely surged, and the ADA/USD increased 2,000 fold, to 1.38. But then the surge ended, and Cardano ended up back where it started at 0.0007. It formed a base there, which it tested in February for the last time, but now the base has moved higher to the 20 SMA (gray) on the monthly chart, as shown above.
Recent Changes in the Cardano ADA Price
| Period | Change ($) | Change % |
| 30 Days | +0.033 | +30.3% |
| 3 Months | -0.023 | -21.1% |
| 6 Months | +0.069 | +68.3% |
| 1 Year | +0.07 | +69.3% |
| Since 2017 | +0.105 | +95.5% |
Factors Affecting Cardano ADA/USD
The Cardano blockchain network was founded by a leading team of scientists and engineers, which makes it stand out from the crowd, as it leads the crypto market in terms of new developments. It is followed by [[Ethereum]] . This cryptocurrency is based on peer-review-research, which attempts to bring it closer to the public, by making it more adaptable. As a result, it undergoes small changes constantly. That is part of the reason why ADA has been among the bullish altcoins since April, having increased around 200 times, from its lowest level of 0.0007. The price retraced lower in August and September, but ADA held most of the gains, and the bullish momentum is resuming again.
| ADA Forecast: Q4 2020 | ADA Forecast: 1 Year | ADA Forecast: 3 Years |
| Price: $ 0.07 Price drivers: Technical indicators, crypto market sentiment, Voltaire development. |
Price: $ 0.15 Price drivers: Release of Voltaire, ERC20 Token Converter, Technical charts |
Price: $ 0.25 – $ 0.30 Price drivers: Cardano evolving, Crypto market sentiment, International legislation |
Cardano ADA Price Prediction for the Next 5 Years
Recent Developments for Cardano
Cardano is a blockchain-based platform that doesn’t necessary need a wallet, competing against other similar platforms, like [[Ethereum]] and EOS, but Frederik Gregaard, the incoming CEO of the Cardano Foundation, made the following statement recently:
“I think the biggest competitors are really the largest technology companies that are around today, the large tech platforms such as Google, Amazon, Tencent, Alibaba, those kinds of players.”
He aims at bringing all these kinds of currencies together, in order to offer the full range of services to customers, rather than them competing against one another and missing the boat that the big companies will take.
Cardano’s team is working on a number of developments in all areas, one of which is Volatire. Voltaire’s aim, which involves the governance area of blockchain, is to evolve Cardano into an outstanding innovation management platform. Cardano will release Goguen as well – the initial feature of the metadata transactions is already out. The next phase of the transformation from a single-asset system to a multi-asset one will come early next year, enabling users to create their own tokens. Besides that, the team is also developing the ERC20 Token Converter feature, which will make it easy to migrate from Ethereum to Cardano.
Cardano ADA Technical Analysis – Will the 20 SMA on the Monthly ADA/USD Chart Send the Price Higher?
As mentioned above, Cardano (ADA) was trading close to $ 0 for a few years, until November 2017, when the demand for cryptocurrencies surged and Bitcoin shot up to $ 20,000, while ADA rose to 1.38. That doesn’t sound like much, but having come from close to $ 0.00, it’s almost an infinity. But, the price started coming down in January 2018, as the demand for cryptos faded, and by May that year, ADA had lost all the gains. Sellers tried the support level of 0.0007 in July and again in February this year, as the 20 SMA (gray) was pushing it lower. But that level held, and the 20 SMA was broken in May.
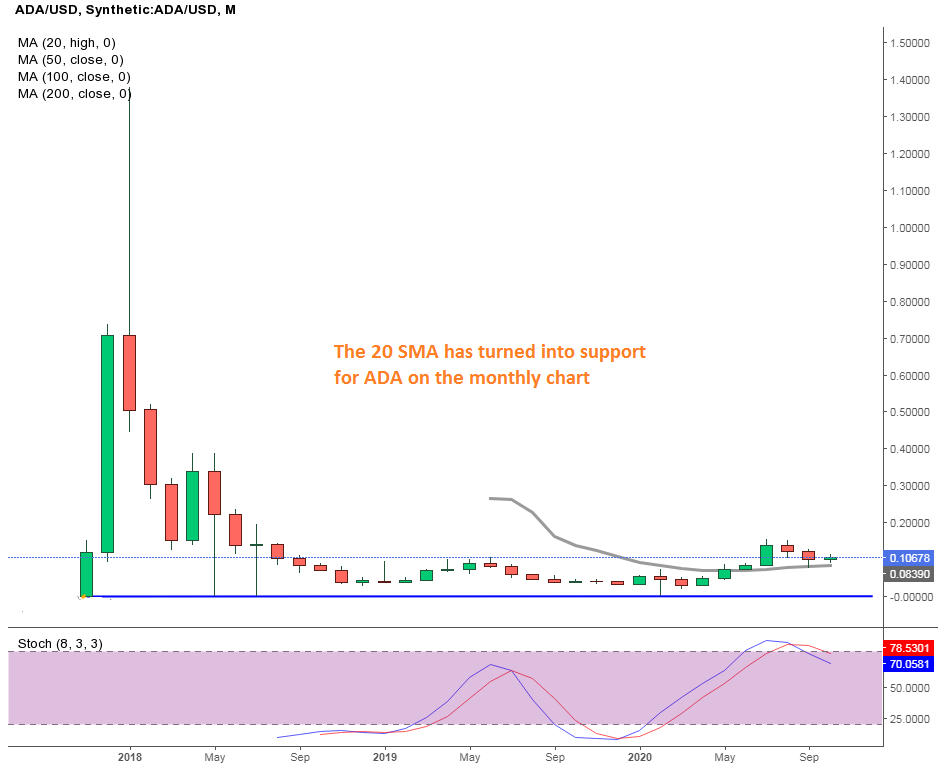
But the stochastic indicator is heading down
Buyers pushed the price to 0.1550s until July, but then came the retrace lower. However, ADA didn’t give back nearly all of its gains, as did some other cryptos. Instead, the retrace down stopped at the 20 SMA, which seems to have turned from resistance into support now. It has been holding since September, and the price is starting to bounce slightly off this moving average. But, the stochastic indicator became oversold in summer, and it is heading down now, so the monthly chart is a bit contradictory, but with a bullish bias.
The ADA price is starting to reverse higher now
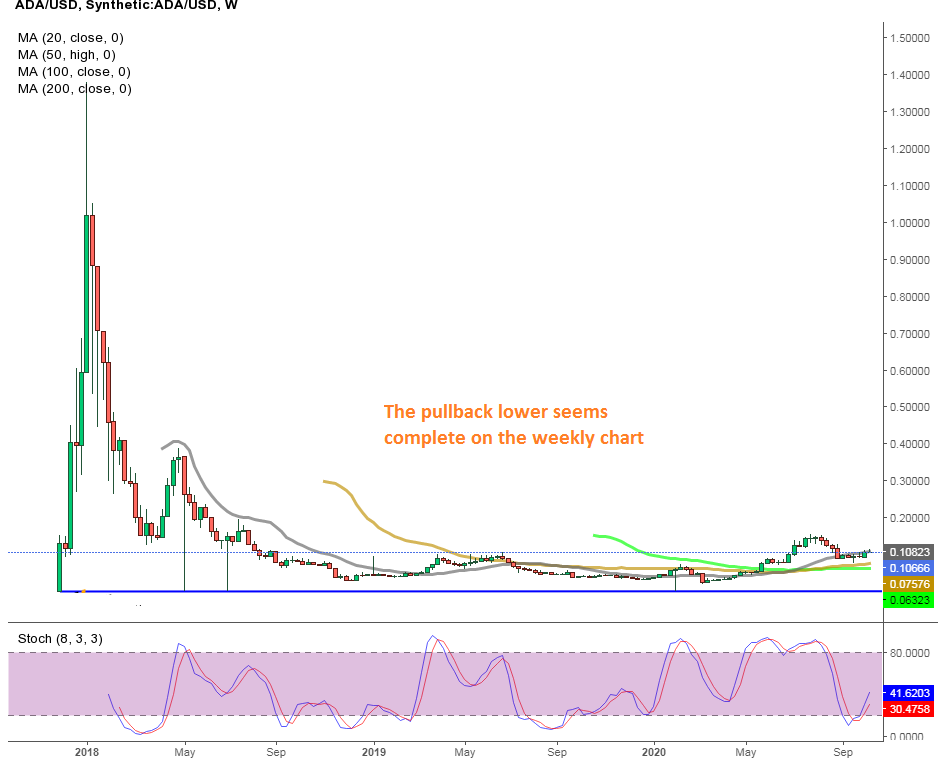
On the weekly chart, we see that after the surge at the end of 2017 and the reversal back down in the first months of 2018, a retrace higher took place in April. But, the 20 SMA turned into resistance on this time-frame, and after a doji, which is a reversing signal, the decline continued. But, the previous low at 0.0007 held and has been holding since then. The 20 SMA kept pushing the price lower, but in March 2019 the ADA broke above it, although the 50 SMA has taken its place since then. Sellers tried the support once again in February this year, but the downtrend in cryptocurrencies ended and this altcoin broke above all moving averages. In September we saw a retrace lower, but the 50 SMA turned into support, and after a doji, the price started to reverse higher. Now buyers are trying to push above the 20 SMA, and if that happens soon, the August high of 1.1550 will be broken.