The FED Turned Bearish All of a Sudden – Weekly Analysis 14 – 20 March 2015
Last week was all about the ECB and their drastic measures of monetary easing in order to ensure economic growth and help the inflation. This week, the spotlight was on the FED. They promised three to five interest rate hikes this year in December – so you would think March would be a reasonable time to start hiking. But, not only did they leave the interest rates on hold, they cut the possible hikes for this year to just two. This was out of the blue because they were more hawkish when there was a much gloomier picture in February. Despite all this ruckus, we had another successful week making more than 100 pips.

The FED went back to being dovish once again (out of the blue)
Forex Signals
This has been another good week for us. It wasn’t great like last week – when we made 300 pips – but it was profitable nonetheless. We got a little help from the slide in EUR/USD prior the FED FOMC statement and we´re happy we closed manually the EUR/USD long-term sell forex signal just before the statement release. We had opened it after the surge in this pair last week when the ECB took drastic measures. It wasn´t an easy week, especially with the unexpected dovish FED statement that caught many traders off guard in the market. We started with a losing forex signal on Monday morning but recuperated well during the day with three winning forex signals, and we finished the day with a 36 pip profit. The same happened on Tuesday, when we started with a losing signal again, but then we had two winning forex signals and closed the day with seven pips. Tuesday was the day we closed the long-term EUR/USD forex signal and also had two winning short-term forex signals; we made a total of 96 pips that day. We had a minor setback in the last two trading days but at the end of the week, we finished with a 105 pip profit.
The market this week
Last week, the European Central Bank was the focus of all the market attention. They had promised to take radical steps in order to combat low inflation and economic stagnation – and they delivered! In fact, they went further with their monetary easing policy and exceeded the market expectations. They cut all the possible rates and increased the QE program, but the market saw it as positive for the Eurozone in the long-term and, eventually, the Euro longs piled in and pushing the Euro 400 pips up. This week, the attention turned to the FED since the monthly meeting was scheduled for Wednesday.
The FED dot plot last December showed that this year we were going to see 3-5 rate hikes, so following that logic the first rate hike for this year was supposed to take place during this meeting. But, with the shock the financial markets went through in February, no one was expecting the FED to hike right now. That being said, the economic situation has improved since the first half of February and the BOJ, PBOC and ECB have already relaxed their monetary policies further, which has helped the global markets a little. Adding to that, the FED were neutral in that February meeting when the things were much worse, so the market was expecting the FED to be neutral to hawkish now. But the FED came out as neutral to dovish, which was a surprise. The dot plot shows that there will only be two rate hikes this year, the inflation forecasts were lowered and the global growth is looking worse off, according to them. That was a surprisingly passive statement and the US Dollar took another beating, losing about 300 pips in two days. There are rumours that Yellen was forced into this during the G20 summit in China in late February. Since then, the PBOC has cut the RRR, BOJ has gone negative on rates and the ECB has fired all guns with German backing, which is a surprise taking into account that they were against and threatening the ECB when the QE program started last year. So, the talk on the market is that this was a global political agreement/plan and it was the FED’s turn comment passively without a warning since that´s all they have to work with.
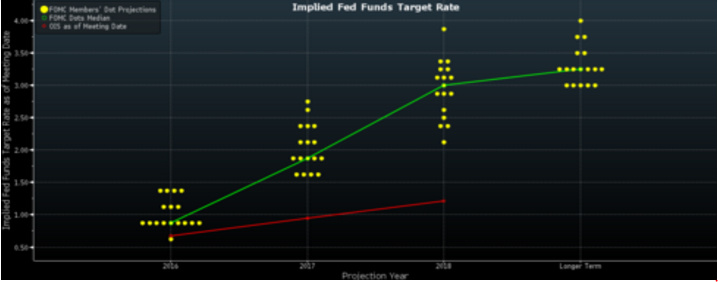
The FED dot plot shows just two rate hikes this year
Economic data
This week started positively with the Japanese core machinery orders jumping 15% in the previous month and the Eurozone industrial production increasing by 2.1%. Tuesday started off on the right foot as well, with the revised industrial production and the tertiary industrial activity in Japan increasing 3.7% and 1.5%, respectively. The French CPI came out at 0.3% later on (from 0.2% expected), but in the afternoon, the US retail sales and the PPI declined by 0.2% and 0.1%. On Wednesday, the British 3m/y average earnings index picked up by 2.1% and the unemployment claims fell by 18k – but the unemployment remained the same at 5.1%. The US core CPI moved up one point to 0.3% but the FED had another agenda and they issued a pretty dovish statement in the evening. The unemployment rate fell to 5.8% from 6% on Thursday morning and the European core inflation fell by 0.2% y/y. The Philly FED manufacturing index jumped 12.4 points from -1.4 previously, and at 265k the unemployment claims remain at a pretty good level. On Friday, the Canadian retail sales grew by 2.1%.
Pair analysis
After the decline in the last few months, USD/JPY has put up a fight during the recent 4-5 weeks. This week, though, the FED turned dovish and the decline resumed once again. The price broke below 111, matching the February low, but another ring around from the BOJ pushed it back above that red line. The weekly candle is still bearish, however, but the daily candle of the last day gives some hope to the USD/JPY bulls, as it closed as a hammer. In theory, this signals a trend reversal. The stochastic and RSI indicators are oversold in both timeframe charts which is another ray of hope for the bulls but the fundamentals and the risk sentiment seem to be the deciding factor right now, and we´ll see how it goes.
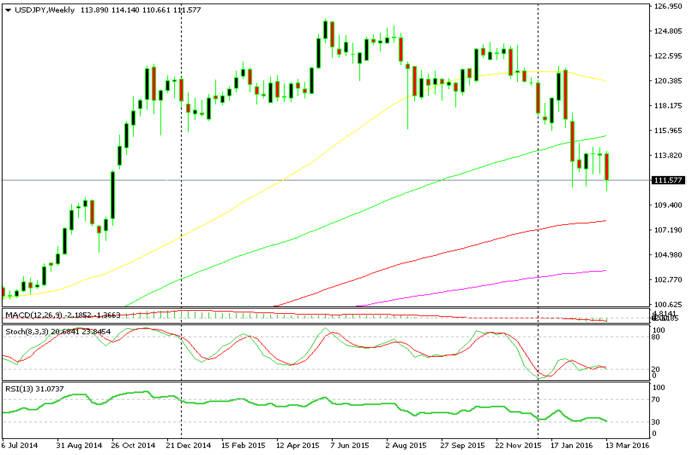
The 111 level was broken but the price jumped back above it
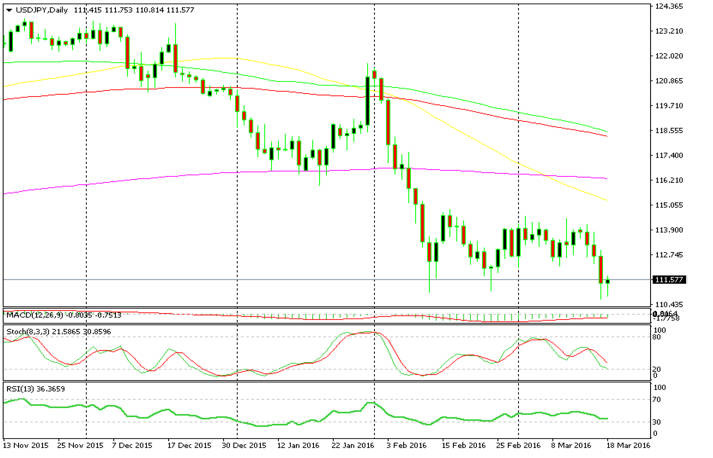
The last daily candle gives hope to the bulls
NZD/USD has been in a long-term downtrend since the beginning of 2014, but since bottoming out in August last year the bears have found it difficult to push the pair further down. This is best illustrated by the fighting between the sellers and the buyers. The 50 MA, in yellow, has provided resistance and the price is hovering, but this week it closed just 20 pips above. That´s not a clear break, but just in case there is a strong resistance line in the daily chart 100 pips above the 500 weekly MA at around 0.69. The price has been rejected three times at that level so we can´t help but think it is the level where sellers have decided to step in. So, since the stochastic is overbought in both daily and weekly charts, we might decide to open a long-term sell signal if the price gets near that resistance level again.
 The price is at the 50 MA in the weekly chart
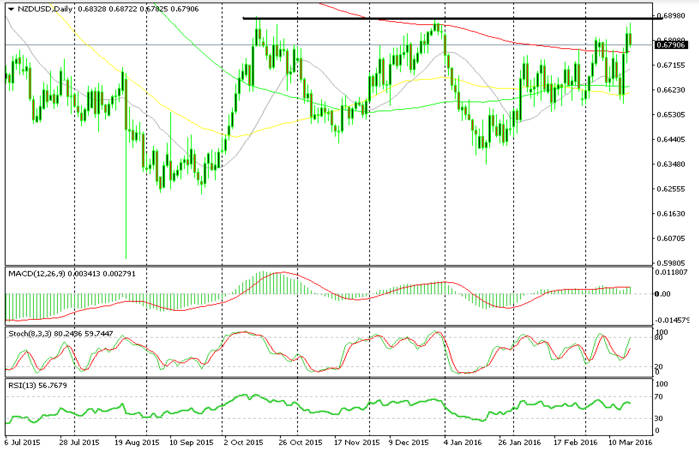
The resistance at the 0.69 level has reversed the price again
The Week in Conclusion
The ECB made history this week and all the attention was on the FED. Many analysts expected them to be neutral to hawkish since the global economic situation is much better now than it was in their previous meeting – but they turned dovish. This caught the market off guard and the US Dollar took a beating for the second week in a row. We still had a good week, since we made more than 100 pips profit. This brings the monthly total to 455 so far. We expect that the market will be a bit more settled next week and hope to make the best of it.
- Click here to view our Forex Signals!
- Check out our free forex signals
- Follow the top economic events on FX Leaders economic calendar
- Trade better, discover more Forex Trading Strategies
- Open a FREE Trading Account

