The USD Popped in to Say Hello This Week – Weekly Analysis 2 – 8 May 2016
Last week, we relied on long-term forex signals and we ended up closing April in good profit because of them – we hope that you benefited as well! The US Dollar has been in a downtrend recently, with EUR/USD peaking at 1.1616 this week without any real reason, and this has made it sort of difficult for us to trade. It finally reversed during the second part of the week and the USD closed about 200-300 pips higher… despite a miss in the US non-farm payrolls (NFP) numbers on Friday. So, we are hoping that the market sentiment has turned bullish towards the Buck; this would clarify things and offer us a leg up.

The lower NFP couldn´t keep the USD down this week
Forex Signals
This week was divided into two parts; the first was defined by a declining US dollar, and the second part was characterized by US Dollar bulls saying ‘enough is enough’. The Dollar reversed during the last three trading days and closed the week more than 200 pips up from the lows, which made trading easier for us. Our performance improved but we just couldn´t finish the week in profit. We incurred a small loss from the long-term forex signal that we opened at the 1.1446 level in EUR/USD. But, we think that there´s more room to the downside for this pair and the profit potential could be quite large, so we decided to leave it until it reaches 1.12, which would bring us nearly 250 pips of profit. Another unfortunate event was the miss in the US NFP numbers on Friday that pushed EUR/USD up and smoked our short-term forex signal that we had opened previously in this pair. This hasn´t been a great week for short-term forex signals after all because the price extended to some new levels that we haven’t seen in a long time in most forex pairs. As examples, USD/JPY reached 105.50s on Tuesday, and EUR/USD reached 1.1616. When the price reaches levels that it hasn´t traded in a while, it needs to spend some time there in order to form short-term support and resistance levels, and then we can trade against these support/resistance levels. The same goes for the moving averages (MA) – they need time to catch up with the price and if the price moves too fast in one direction, we are left with very few indicators to plan our strategy. This has reduced our win/loss ratio for the week from 63:37 against 75:25 (which is our long-term average). USD/CAD has rallied nearly 500 pips from the lows on Tuesday so if you held on to the forex signal we provided when we went long on this pair at 1.25, you should be sitting in a 300 pip profit by now.
The market this week
The market has been difficult to manage during the first two days this week. It followed in the footsteps of last week and pushed the US Dollar down to new extremes which we haven’t seen in awhile. EUR/USD didn’t face much resistance at the 1.15 level, and it made it to 1.1616 quite easily, while the Japanese Yen yanked the Buck around and posted new lows on Tuesday. Then, all of a sudden, everything changed as if by magic. The bearish sentiment towards the Buck turned bullish and the US Dollar enjoyed some good demand in the remaining three trading days. Even the miss in the US employment numbers on Friday couldn´t stop the USD bulls. This currency is not out of the woods yet, because it still is only 200 pips above the lows against the some currencies, so if the USD bulls want to see the Buck at last year´s levels, then the USD uptrend needs to pick up the pace – and soon.
A point to note this week has been the decline of the Canadian Dollar (CAD), which in turn translates into USD/CAD strength. The Canadian Dollar has rallied 23 cents in the last few months due to the appreciation of the oil. But the CAD has lost nearly 500 pips against the USD since Tuesday. It´s true that US and UK oil has backed off a little from the recent highs, but the biggest decline has happened on Monday and Tuesday while the decline of the CAD took place on Wednesday, Thursday, and Friday when oil had been steady. But, it is not for us to reason why, as we can only follow the price action and trade what´s in front of us. The market can go against all logic as we have often seen in recent weeks. Another event worth mentioning was the 25 basis points (BPS) rate cut by the Royal Bank of Australia. The Australian Dollar lost about 150 pips immediately and has been weighed down ever since.
Economic data
This week, we´ll take a look at three economies: the Chinese, the Australian and the United States. The Chinese manufacturing PMI numbers slowly crawled to 50 points on Sunday to flatline, which means that this sector is growing. The numbers have been getting better in the last two months and this signals that the crisis is over for China. That´s one of the main reasons that the market sentiment has improved recently and the risk appetite has returned. Last week, the inflation (CPI numbers) in Australia turned negative and AUD declined by more than one cent. This week, many analysts were expecting a cut in the interest rates – and the RBA did so by 0.25% on Tuesday; AUD has declined another 300 pips since then. Analysts are predicting another cut in the near future and this bearish outlook is weighing on the Aussies. In the US, the employment numbers (NFP) on Friday missed expectations but that was priced in already by the market because the ADP non-farm employment numbers on Wednesday also missed the mark. Moreover, the employment sector is quite solid in the US, with many officials commenting that ~ 100k new jobs a month is enough to absorb the new workforce. During the last year, around 200k jobs have been created each month, so a blip in the job sector of less than that (160 new jobs) won´t change the trend – the reaction of the USD showed that. It lost about 50 pips after the release but quickly reversed and closed the day up against most pairs.
Pair analysis
EUR/USD has been in a slight uptrend since last December. It can be considered as a correction of the larger downtrend as well. At the beginning of this week, the uptrend continued from last week and the price broke above the 1.1450-1.1500 resistance level. It reached 1.1616 on Tuesday where it met the 100 MA in the weekly chart. This proved to be a step too far, and so it reversed back down and closed the week near the lows. On the daily chart, we can see that Tuesday closed as an inverted hammer. This is a sign of reversal that came to fruition over the next three days. On Friday, the buyers had a go at the upside after the US employment data missed the expectations, but they failed and the day closed near the lows at 1.14, so right now the sellers remain in control.
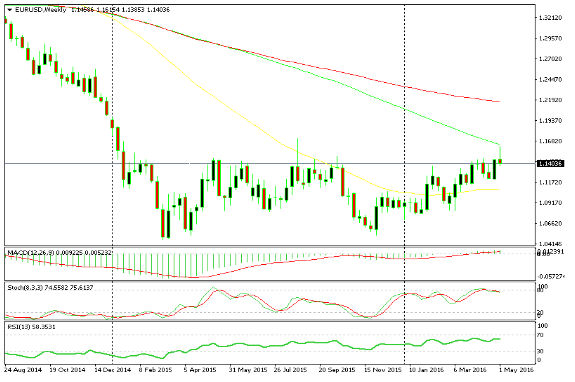
The 100 MA in the weekly chart provided strong resistance
The daily chart paints a bearish picture
After a long-term uptrend, USD/CAD entered a period of correction in January of this year. The correction was also partly triggered by the correction in the price of oil, which reached $46/barrel from around $26/barrel in February. USD/CAD declined nearly 23 cents in a straight downtrend – as you can see in the daily chart. But the 100 MA in the weekly chart provided solid support and this week the price has gone up about 5 cents from the 1.2450 lows. It broke the downtrend line in the daily chart and that is a sign that the correction might be over and we´ll be seeing the larger uptrend resume once again. This week´s candle is a bullish engulfing candle and is another sign that the uptrend will resume soon if it hasn´t done so already. But first, we need to see the price break above 1.30 and then 1.33.
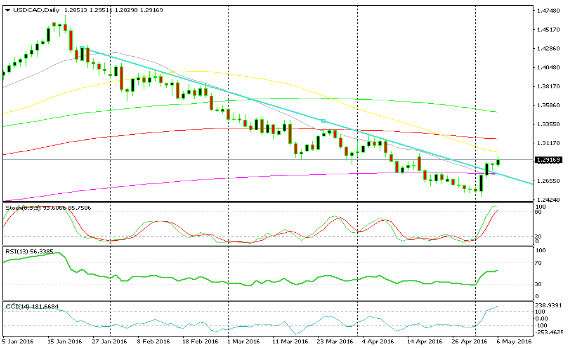
The downtrend line has been broken
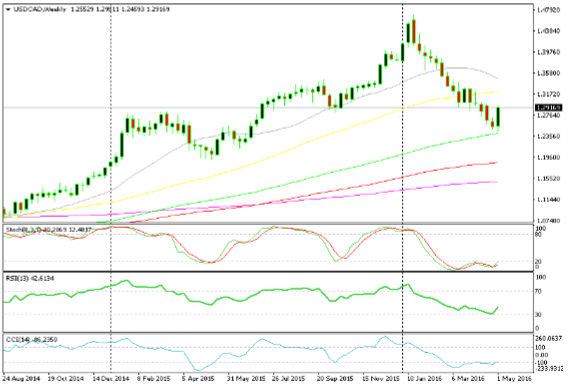
The 100 MA provided strong support
The week in conclusion
We have closed the first week of May and things are looking a little brighter now than they did at the beginning. Last week, the risk sentiment was off and the market kept selling the USD, so the first two days of the week were stagnant and the USD reached new lows against some of the majors. But on Tuesday, the sentiment reversed and the Buck closed the week about 200-300 pips higher. Next week, the economic data will be sparse apart from the US retail sales and the producer inflation on Friday, and so it will be entirely up to the market to decide where to take the price.
- Check out our free forex signals
- Follow the top economic events on FX Leaders economic calendar
- Trade better, discover more Forex Trading Strategies
- Open a FREE Trading Account