Focusing on the Eurozone and Germany For the Day
•
Last updated: Thursday, July 28, 2016
With one of the high level event risks – the FOMC meeting – behind us, the next major focus is on what the Bank of Japan is going to do tomorrow. But in the meanwhile there is some important data out of Europe today. As mentioned above, we will encounter German unemployment, and CPI (consumer price index) numbers. Just how much market movement we might get out of these events is difficult to say, nevertheless, we ought to be mindful of its potential impact on the exchange rates. We will look at different major pairs today, but let’s first hop to the EUR/USD:
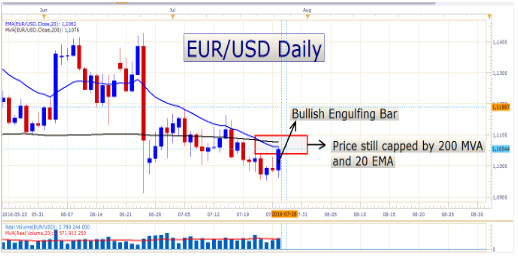
EUR/USD Daily Chart
As you can see, the EUR/USD posted a pretty impressive bullish engulfing daily candle yesterday. With the price still holding below the 20 EMA and 200 MVA, it is difficult to be married to a certain directional bias at the moment. The FOMC meeting last night has abruptly shuffled around the bearish momentum on this pair, howbeit, this might be just an ‘emotional pop’ in the exchange rate, offering some better prices for sellers to enter at. Here is the same chart with support and resistance zones:

EUR/USD Daily Chart with Support and Resistance zones
As you can see, it looks like the pair is caught between important levels at the moment, with price oscillating between support and resistance over the short term. I reckon that the risk is still tilted to the downside on this pair, as long as price is contained by the moving averages on this chart, and also the resistance zone displayed above. I am just not too confident that we will see a larger move lower, as I still see some longer term bullish signs over the horizon. This could change very quickly, of course. If we see revived risks to the Eurozone, and perhaps some added threats to the political and financial stability of the area, the single currency, as the Euro is also called, could plummet further. But for now, we’ll see what the news will offer today, and whether we will get an uptick in the German CPI or not.
Look at the market’s reaction to the FOMC last night, on a smaller time frame:

EUR/USD Hourly Chart
For traders interested in short selling this pair, I would not recommend doing it right away without some sort of confirmation. Sometimes it takes a lot for the price to slow down after such a forceful move like this, and perhaps the FOMC's outlook of US inflation will still remain low for some time, and might outweigh the other positive economic factos in the near term. Which is maybe why market players drove the USD lower a few minutes after the meeting. (The initial reaction was USD bullish).
Besides these factors, the retail sentiment on the EUR/USD is pretty flat at the moment, possibly indicating that we might not see the strong directional moves most traders are looking for. I say most traders because not all traders are looking for trending markets because they are range traders.
To look at some other pairs, the USD/CAD printed a pinbar star/shooting star daily candle yesterday, indicating that perhaps we might get a pullback to the level where the recent breakout occurred. See the chart below:

USD/CAD Daily chart
The price remains supported by the 20 EMA (4-hour data source) however, and as long as price remains supported by the shorter timeframe indicators, it might not lose enough steam to reach the breakout level mentioned above. On the hourly chart below, you can see how that price pierced the green 20 EMA (4-hour data source) several times, but could not close below it:

USD/CAD Hourly Chart
The USD/CHF is very much sideways, despite the large bearish candle that was printed yesterday. Price remains supported by the 200 MVA – notice all the action around this moving average (the black moving average on the chart below), seen with many wicks piercing it in the last few days:

USD/CHF Daily Chart
The USD/JPY is anxiously awaiting the BOJ’s actions and decisions on Friday for some directional clues. At the moment the price is above the 20 EMA on a daily chart. Price action might be somewhat subdued until Friday’s expected action, except if we see a lot of pre-positioning before the time. I will focus more on this pair in tomorrow’s trading plan. See the chart below:

USD/JPY Daily Chart
The AUD/USD remains negative for now, with the price still being resisted by the 20 EMA. Perhaps the price will not move down immediately, but my bias is still bearish on this pair.

AUD/USD Daily Chart
Enjoy your trading day!
- Check out our free forex signals
- Follow the top economic events on FX Leaders economic calendar
- Trade better, discover more Forex Trading Strategies
- Open a FREE Trading Account
- Read our latest reviews on: Avatrade, Exness, HFM and XM
ABOUT THE AUTHOR
See More
Dime Levov
FXL Admin
Related Articles


Sidebar rates
Related Posts
