Be Prepared For Some Decent (Price) Action Tomorrow!
Today was a choppy day in the forex market. Although we didn’t see massive moves, at least there was enough movement to capture a couple of pips. The US dollar traded lower against most major currencies, but the Euro and the Swiss Franc were even weaker than the Greenback. This afternoon the US Conference Board consumer confidence number came in far better than expected. The index rose to 104.1 in September which is the highest number in nine years. This didn’t have a massive impact on the FX market, but it is something to keep in mind when making trading decisions which involve the US dollar, and the USA. This index is a leading indicator which could predict consumer spending, which in turn plays an important role in any healthy economy.
EUR/USD
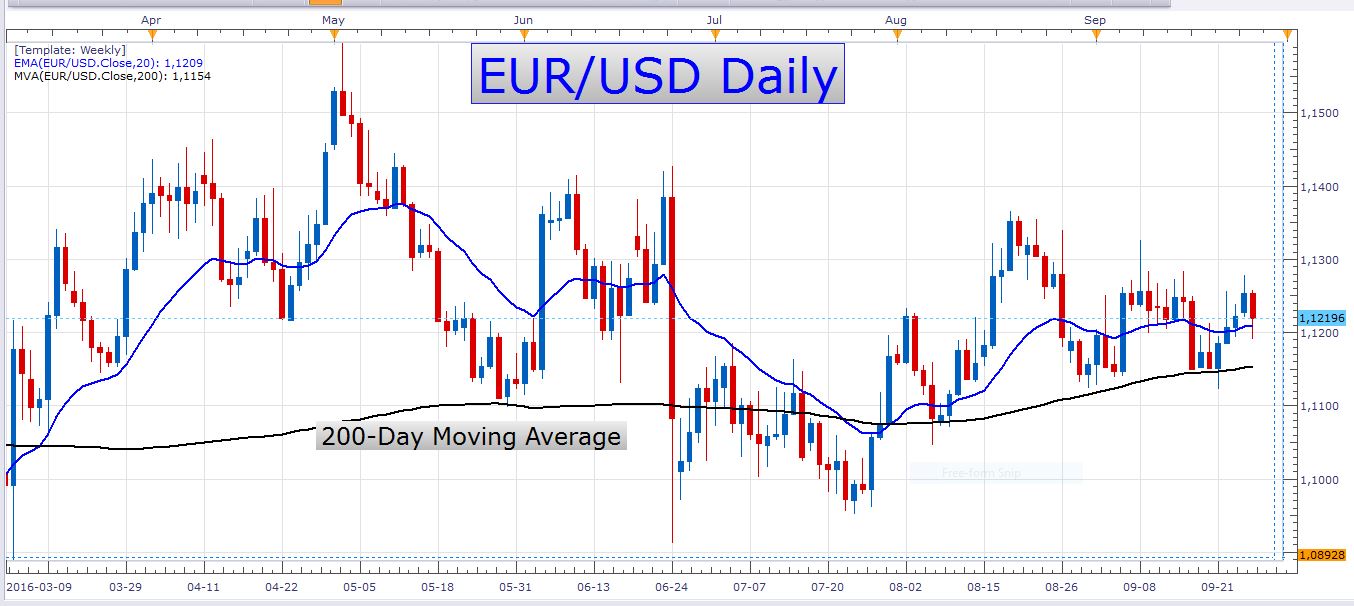
EUR/USD Daily Chart
As you may have noticed, the price action on this pair has recently been largely sideways. Nevertheless, the 200-day moving average has been supportive to the exchange rate, and the last bounce off of this very important indicator occurred only a few days ago. A few weeks ago I wrote about the long-term outlook for the pair which bears some bullish characteristics. One thing is certain, at the moment there is an absence of aggressive selling of this pair. Besides this, the retail sentiment on this pair points to further gains in the exchange rate, as the majority of retail traders which are involved in this pair are engaged in short positions. Remember that retail FX traders are wrong most of the time, and that retail sentiment is used as a contrarian indicator to the price. At the moment there are 1.43 short traders for every trader that is long. Although this ratio isn’t very extreme, it is still a valuable piece of information.
The EUR/USD has not been an easy pair to trade lately. When a pair just chops around like this, the inexperienced traders easily lose money. Of course, the range traders take their share in these trading conditions, provided that they use the correct analysis and execution. Look at just how suitable to range trading the price action has been on a 4-hour chart:
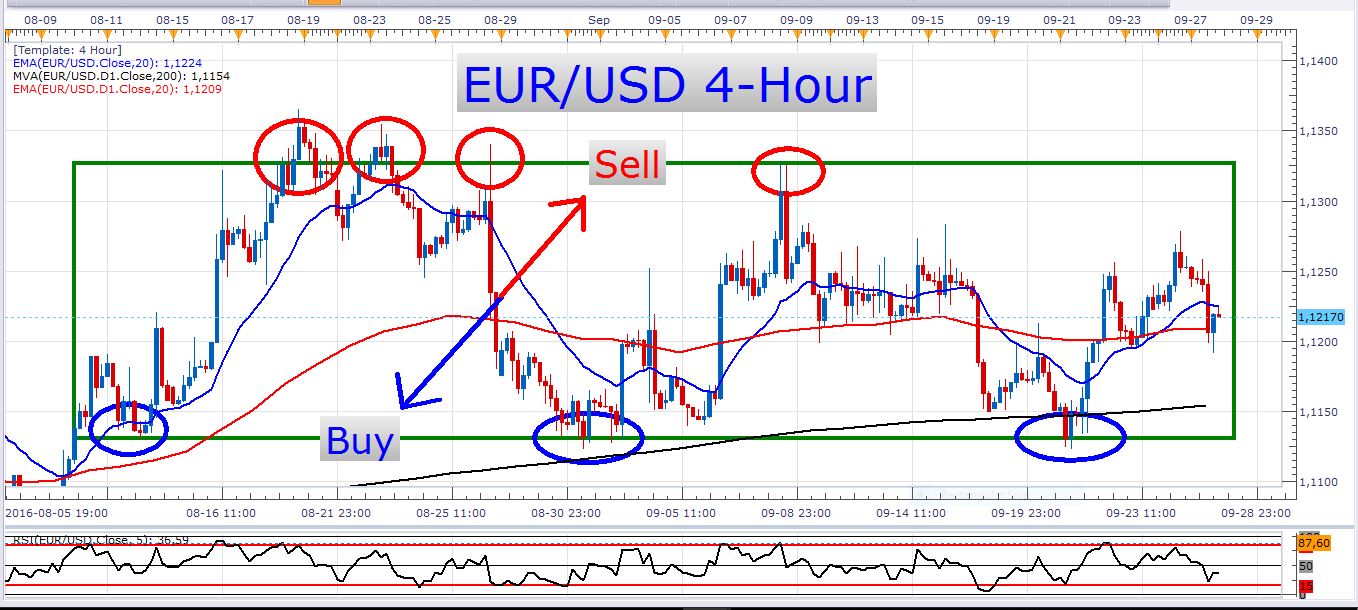
EUR/USD 4-Hour Chart
The RSI indicator, as seen at the bottom of this chart, can be very useful to time trade entries in ranging markets. Other oscillators like slow stochastics can also be used.
USD/CAD
USD/CAD Daily Chart
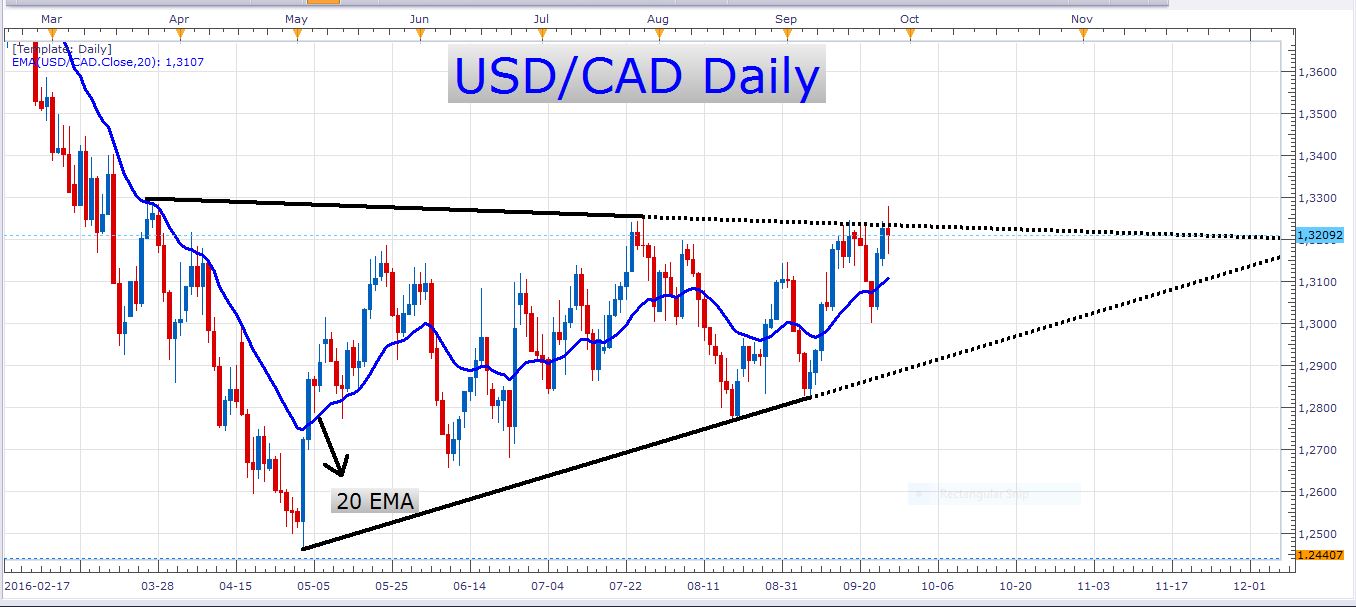
At the moment the pair is sitting at the range resistance, and perhaps we might see the pair break out of this range soon. It is worthy to note that the pair has been printing higher highs and higher lows over the last few weeks, as you can see in the chart above. If you are trading this pair, you need to be aware of tomorrow’s Opec meeting. Remember that the Canadian dollar is highly correlated to the oil price and that the Opec meetings have the potential to rock oil prices. We also have US crude oil inventories scheduled for tomorrow which is also known to be an oil price mover. The Opec meeting is at 14:00 GMT, and the crude oil inventories at 14:30 GMT.
As I have explained in recent articles, the USD/CAD can be traded by waiting for it to break out of the range in which it finds itself at the moment. After the breakout happens, traders can wait for a pullback to occur before entering long positions. Of course, the pair might not be able to accomplish a topside breakout after all. It could just as well fall back into the familiar range in which it has been trading for quite a while.
USD/JPY
USD/JPY Daily Chart
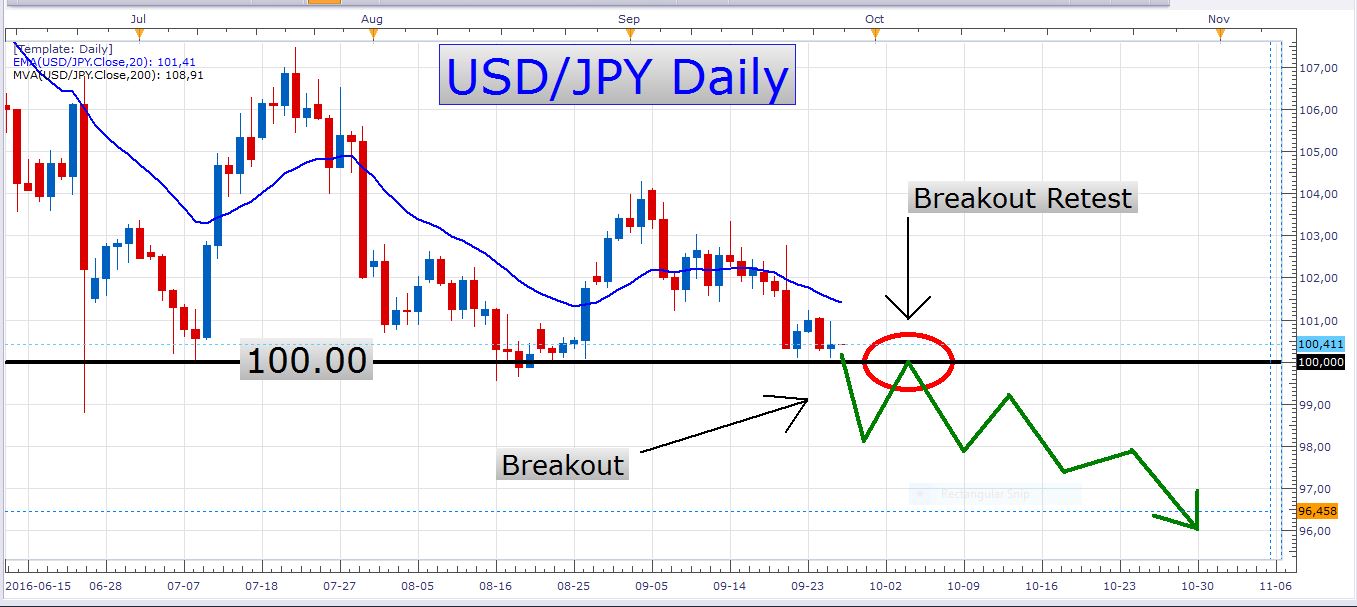
This is a pair I’m really excited about! I just checked the retail positioning on it, and it’s really very extreme. For every trader that is short, there are more than six traders holding long positions. This is a pointer to a further decline in the exchange rate. As I mentioned in previous articles, the pair is trading at extremely important technical levels at the moment. This is a critical support zone. If the pair slipped through this major 100.00 level it could suffer great losses. This is such an important psychological level for this pair. You can be sure that many market players are watching this pair very attentively. You can know for sure that many traders will enter new short positions if the pair breaks through the 100.00 level. On the other hand, many traders who are holding long positions will close them if this happened. This would just add to the strength of the decline. And then, many traders have already entered short positions in expectation of a downward breakout. My personal game plan is to wait for the breakout to occur first, followed by a retracement of the price. The 100.00 level would be my preferred level to enter a short position at. This is indicated by the red ellipse marked ‘Breakout Retest’ on the chart above.
Besides all the important speeches tomorrow, we also have the US Core durable goods orders print to be released at 12:30 GMT.
Have a profitable day!
- Check out our free forex signals
- Follow the top economic events on FX Leaders economic calendar
- Trade better, discover more Forex Trading Strategies
- Open a FREE Trading Account
- Read our latest reviews on: Avatrade, Exness, HFM and XM
Related Articles


Sidebar rates
Related Posts
