An Analysis of Our EUR/CHF Signal
Yesterday we opened a short-term buy forex signal in EUR/CHF at around 1.0920. We had a good run of winning signals since Friday, so another winning signal and a handful of pips wouldn´t hurt us. But, what persuaded us to go long on this pair?
The reasons are mainly technical but the fundamental picture is also in our favour. The SNB (Swiss National Bank) is clearly on our side, because those guys have been buying this forex pair ever since the BIG Bang. You must remember the 50 cent drop in CHF pairs after the same guys removed the 1.20 peg in EUR/CHF. The SNB chairman Jordan even appeared on TV yesterday saying that the Swiss Franc is still overvalued, but the jump in EUR/CHF came only a few pips short of the take profit level.
The 1.09 level looks like a very strong support area
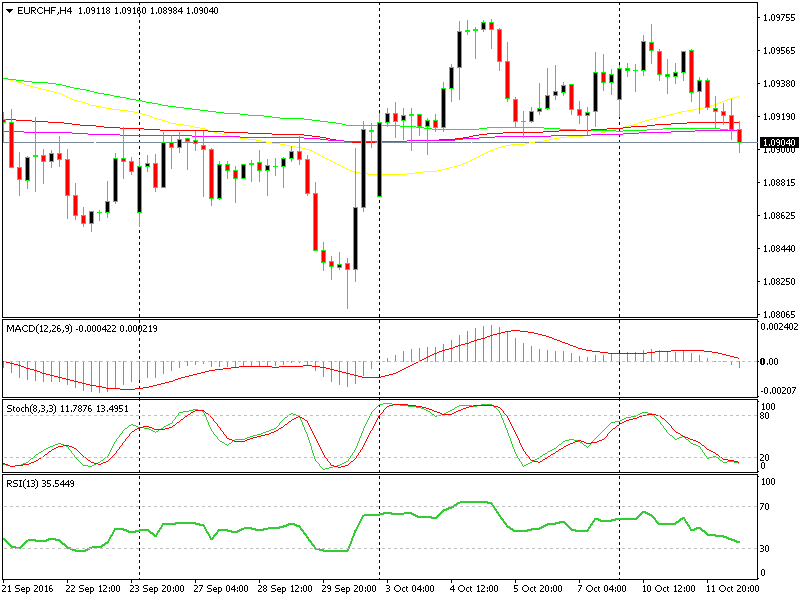
Anyway, this pair has lost some of its shine overnight, but the technical picture remains bullish. As we can see on the H4 forex chart, the 1.0900-10 level where the price is right now has been a resistance level on Friday and Monday. But once the price broke above it yesterday, it turned into a support level. Besides that, a number of moving averages have gathered there, which gives this support level extra strength.
The stochastic and RSI indicators are another reason for this buy forex signal. The stochastic indicator was close to the oversold area when we opened it yesterday and it reached that level overnight. Even the RSI indicator is almost oversold on the H4 chart.
If you switch to the daily chart, you can see that the 100 simple moving average has provided solid resistance in the last few months, but it had to let go at some time. The price right now is just above that moving average, so you do the math.
SO, how many indicators are signalling a long position here?
1. Bullish fundamental picture
2. Strong resistance area on the H4 chart
3. A confluence of moving averages on the H4 chart
4. Oversold Stochastic and RSI on the H4 chart
5. The 100 moving average on the daily chart
Are these five reasons enough for you guys? I know that the price has slipped below the moving averages on the H4 chart, but it can only be considered as a proper break if the H4 candlestick closes below them and there´s plenty of time for this candlestick to close. If the price closes above those moving averages then it will be another strong signal in our favour.
So, as you can see guys, this is the analysis we conduct before opening a forex signal. The situation might change during the time the signal is open, but we continuously re-evaluate it. There will always be losing signals, but it has worked for us for many years, so we´re pretty confident about this trading strategy.
- Check out our free forex signals
- Follow the top economic events on FX Leaders economic calendar
- Trade better, discover more Forex Trading Strategies
- Open a FREE Trading Account
- Read our latest reviews on: Avatrade, Exness, HFM and XM
Related Articles


Sidebar rates
Related Posts
