Economic Data is Light this Week, But the US Presidential Elections Could Shuffle Things Around. Major European Currencies are Leading the Way into the New Week
While many major currency pairs are still caught up in ranges, there’s been some strong moves in the currency market last week, especially on some of the lower timeframes. The US dollar was definitely not a beneficiary of this volatility, and moved lower considerably, especially against the Euro, the pound, and the Swiss Franc. Look at this US dollar index chart:
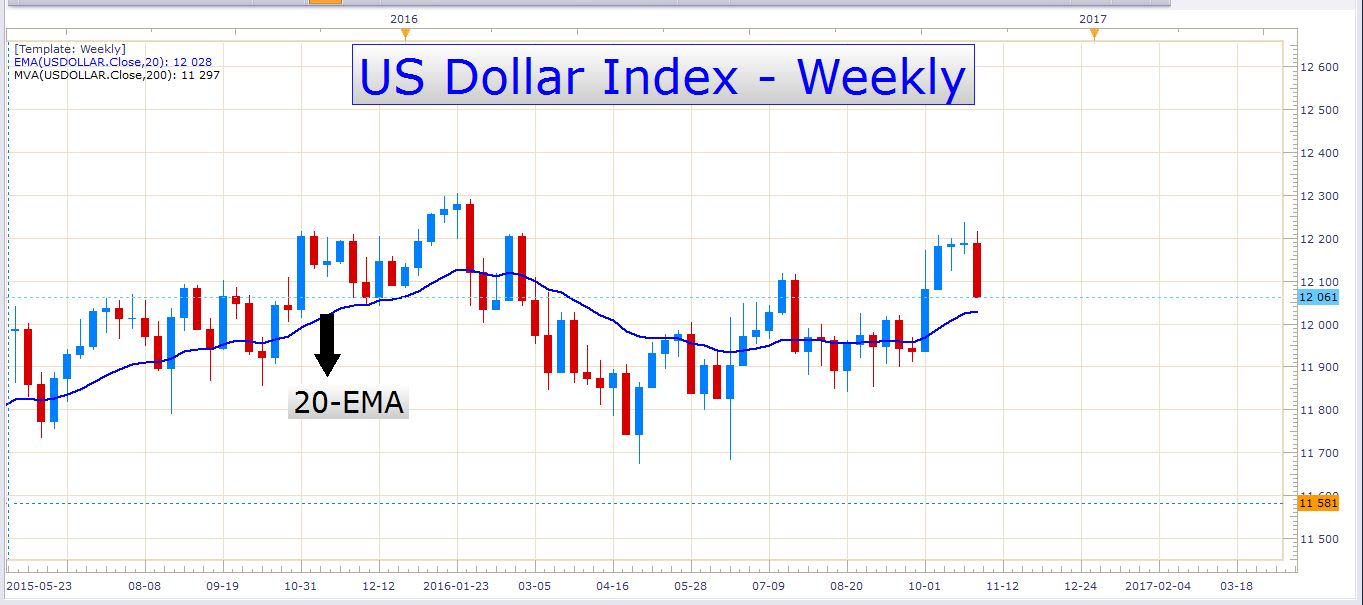 US Dollar Index Weekly Chart
About four weeks ago, the US dollar rose impulsively. This seemed like a move that would have some decent follow through. What a disappointment to see that the Buck has formed a lower low on the daily timeframe. Look at this daily chart:
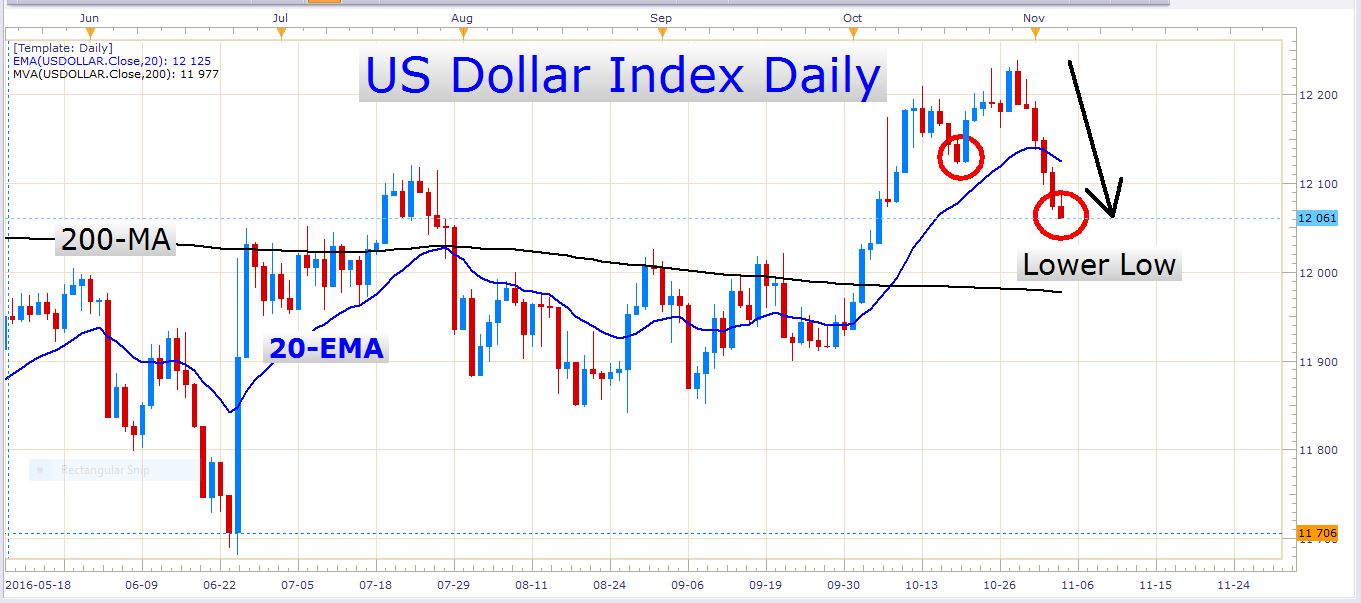
US Dollar Index Daily Chart
This is not the type of setup you want to buy into, especially on the lower time frames, like for example, an hourly chart. Traders who shorted the dollar last week probably made some handsome profits, especially those who bought the pound. The pound gained about 330 pips against the dollar last week. Look at this impulsive ascent:
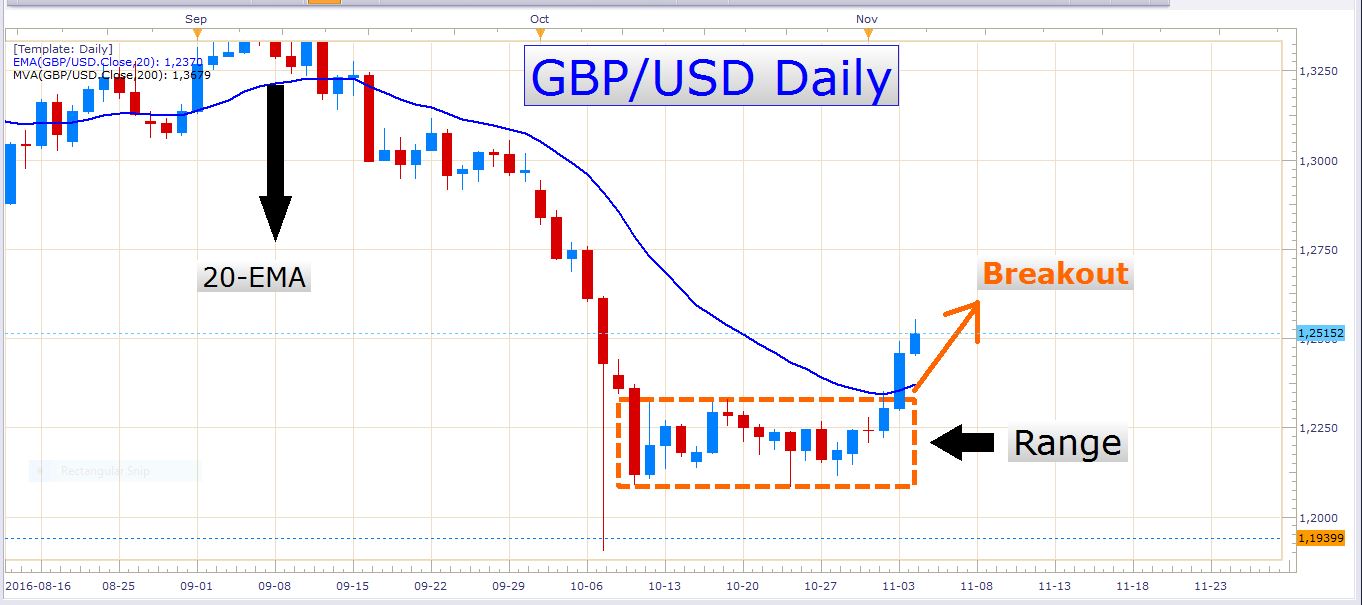
GBP/USD Daily Chart
As you might have noticed, the price closed firmly above the 20-EMA on Thursday, and the strong bullish momentum spilled over to Friday, as the pair managed to form a higher high on the daily timeframe. I’m sure many traders are excited to see that this pair has broken out of the tight range in which it was caught up. It’s always great to see a currency pair explode into action like this. Let’s look at an hourly chart of Cable:
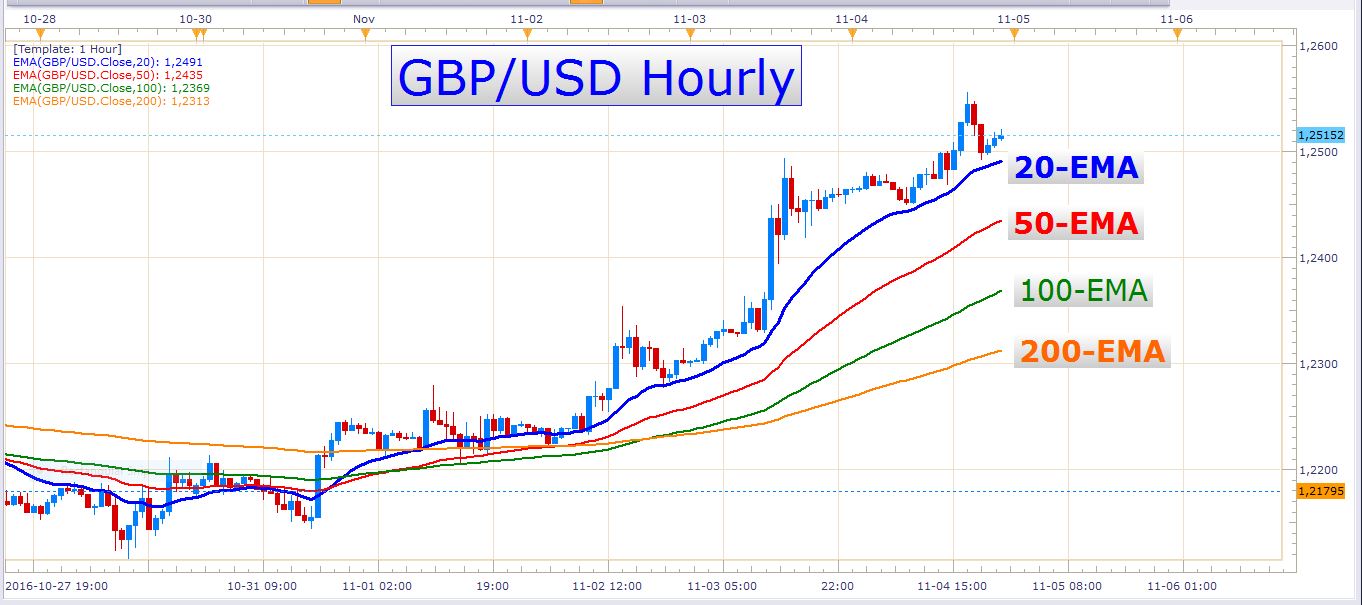
GBP/USD Hourly Chart
This is what strong bullish momentum looks like. Notice the large distance between the exponential moving averages. You will also see that the price hasn’t touched the 20-EMA in the last 50 candles. At the moment there is no reason to fight this upward momentum. As long as the pair continues to print higher highs and higher lows, we can ride the wave to make some profits. Perhaps we could see some mild pullbacks as we start out the trading week tomorrow, but I suspect that market participants will snatch up these dips and drive the pair higher.
On the daily chart, the next important resistance zone is about 300 pips away, so the pair might still have plenty of space to continue its ascent. Look at this daily chart:
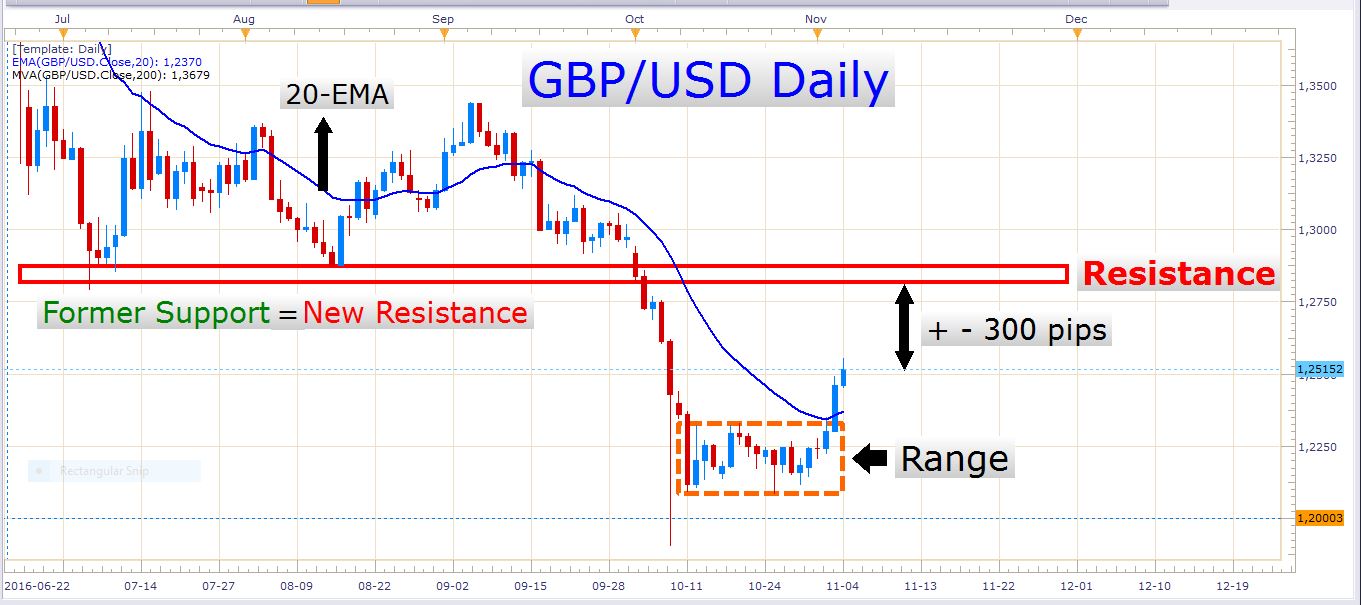
GBP/USD Daily Chart
There has been an important shift in the market sentiment on Cable in the last week or two. The activation of the Brexit negotiations seems to have met some headwinds, and UK inflation is likely to increase rapidly. Furthermore, the outlook for economic growth has been sharply revised upward which indicates that the UK economy is in better shape than many people have perhaps thought.
We currently have the perfect environment for a strong push higher in the GBP/USD. The reason for this is that the recent rise in the exchange rate has started to trigger stop losses of traders who held short positions, and there are still many traders holding short positions who will have to close them if the price rises further. This is what we call a short squeeze. Remember that a short position can only be closed by a buy transaction. So when a lot of traders get stopped out of their short positions, this adds to the buying pressure and can cause a bullish move to accelerate tremendously. Although many short traders have been stopped out already, the pair still needs to rise further to really trigger a genuine, serious short squeeze. The reason I say this is because on a daily chart the price is still trading below resistance, and the trend can still be considered to be down, especially when you look at a weekly chart.
If we keep all these things in mind, there could be some profits to be made by buying the pound against the dollar. Entries can perhaps be taken on corrective pullbacks to the 20-EMA on an hourly chart, for example. I say corrective because we don’t want to trade an aggressive pullback as this reduces your probability of winning the trade. If you want an idea of what a corrective pullback is, you can scroll up and look at the GBP/USD hourly chart again. The pullbacks that occurred after the price broke through the moving averages from beneath were all weak, corrective pullbacks. These are the right type of pullbacks which offer high probability trade setups.
The only important economic news out of the UK this week is the September manufacturing production number which is scheduled for 09:30 GMT on Tuesday.
USD/CAD
This pair is still holding on to its bullish momentum at the moment, despite Friday’s weak pinbar candle. The upside still looks very attractive despite the recent US dollar weakness. I don’t like the current price level for a long entry, however. Friday’s pinbar candle warns us that there might be a bearish correction on the way. Look at the following chart:
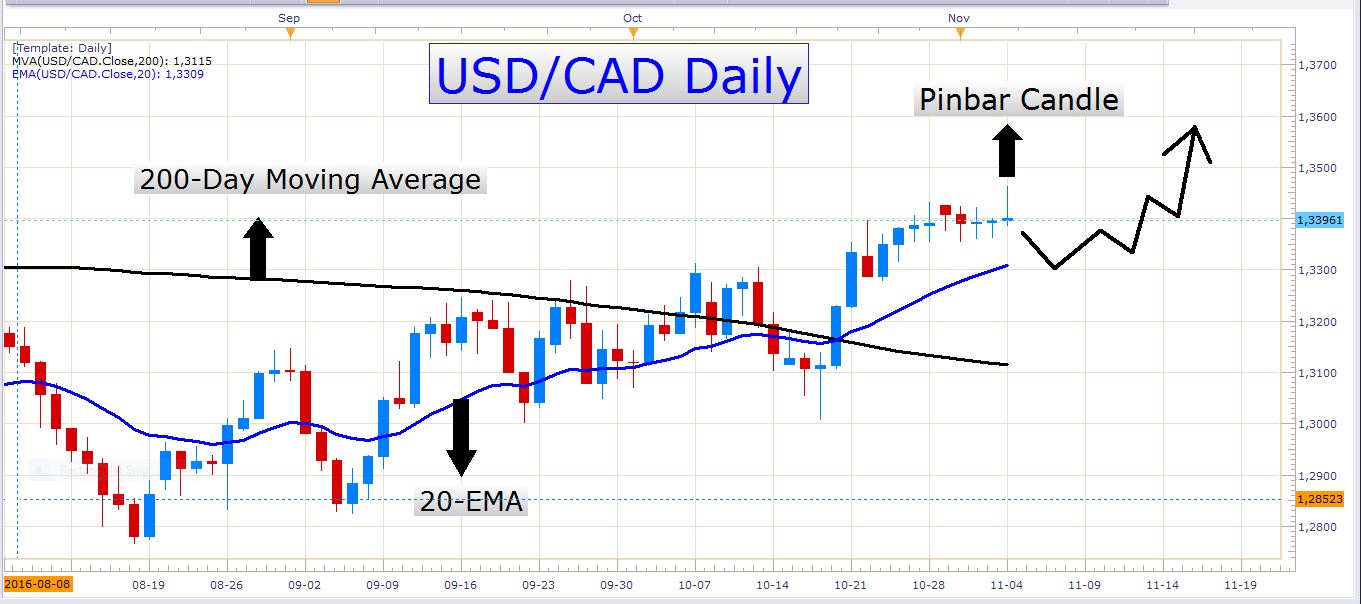
USD/CAD Daily Chart
I think a retracement to the 20-EMA might offer a good level to enter into a long trade on this pair. If the price fails to retrace to this moving average and starts to resume the uptrend, we could look to smaller timeframes like the 4-hour or hourly charts to fine-tune a long entry.
The aggressive decline in the oil price over the last two weeks has put a lot of pressure on the Canadian dollar. This has helped the USD/CAD a lot because the US dollar has been considerably weak over the last couple of days.
EUR/USD
The buying pressure on the EUR/USD is just not losing steam. It is trading at a price which is at a previous support zone (on a daily chart). This is a dangerous place to buy, as this zone of former support could act as a new zone of resistance. I do not like the idea of initiating long trades at the current overbought price. The larger picture of the EUR/USD is that of a range-bound pair, and that means that we could be heading to levels where it could be much better to sell the pair than to buy it. The pair is fast approaching the 200-day moving average, and this could, of course, be an important level where the bears might start to fight back with some selling. It could also be a level targeted by long traders, so it might take a lot of strength to break through and clear this very important moving average. Look at the following chart:
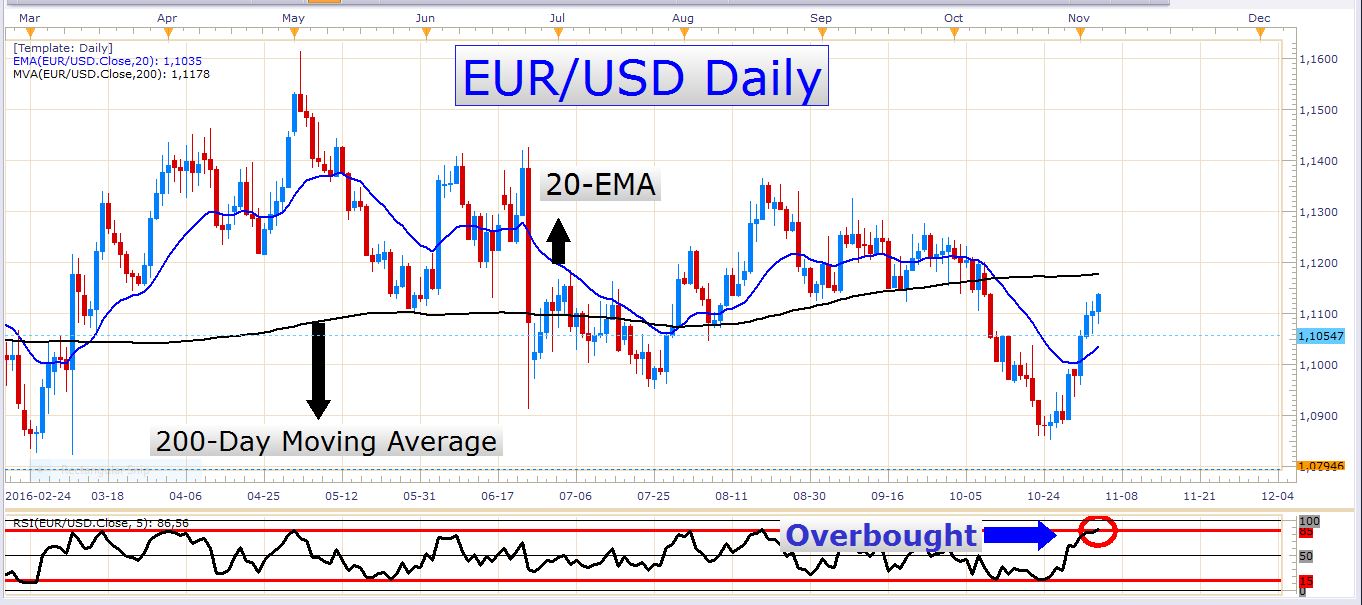
EUR/USD Daily Chart
USD/CHF
This pair has declined very aggressively over the last few days. My short-term bias is definitely bearish, and the pair is fast approaching the lower quartile of the recent range in which it’s been trading.
AUD/USD
This pair is still trading in a wedge, and it doesn’t seem like we’re going to get a powerful break out of this wedge in the next few days.
Be careful when you trade this week, as the US Elections could cause great volatility. The voting day is on Tuesday, and the results will be released on Wednesday.
Have a prosperous week!
- Check out our free forex signals
- Follow the top economic events on FX Leaders economic calendar
- Trade better, discover more Forex Trading Strategies
- Open a FREE Trading Account


