The Big Level In USD/JPY – Which Side Will You Pick?
The Japanese Yen has been a strange chap in the last several years. It has moved about 50 cents up since 2011, but it lost half of the gains this year when it fell from 1.25 to 0.99 after the Brexit vote. It repeated the same round trip this week but at a much smaller degree. We saw the dive to 101 after Trump`s win became clear on early Wednesday, only to reverse and threaten the 107 level a day later.
The problem is it hasn't been able to break that resistance level for two days now. The market sentiment has been very positive towards the USD since Wednesday, but if the price in this forex pair doesn´t break above this resistance level soon, then a retrace or a reverse might follow next.
Looking at the daily and weekly USD/JPY charts, we can see that the 100 smooth moving average (100 SMA) in both daily and weekly chart is providing strong resistance. It provided support on the way down in the weekly chart of mid-July, so it´s normal that it turns into some sort of resistance now.
Technically, if I was to pick a side for the medium term (several months), by the look of the daily forex chart, I would stick to longs. The 50 SMA in yellow and the 100 simple MA in green have been pushing the price down during the entire year, but now they have been broken. That means that the trend has changed for this forex pair and these MAs will likely turn into support now.
Judging by price action, the failure to break the big 100 support level and the surge in the last few days means that the market is done with the downside. The sentiment has now shifted to positive, so both analysis point up.
The problem is that we don´t have an open buy forex signal in this pair, so where should we get on the northbound train?
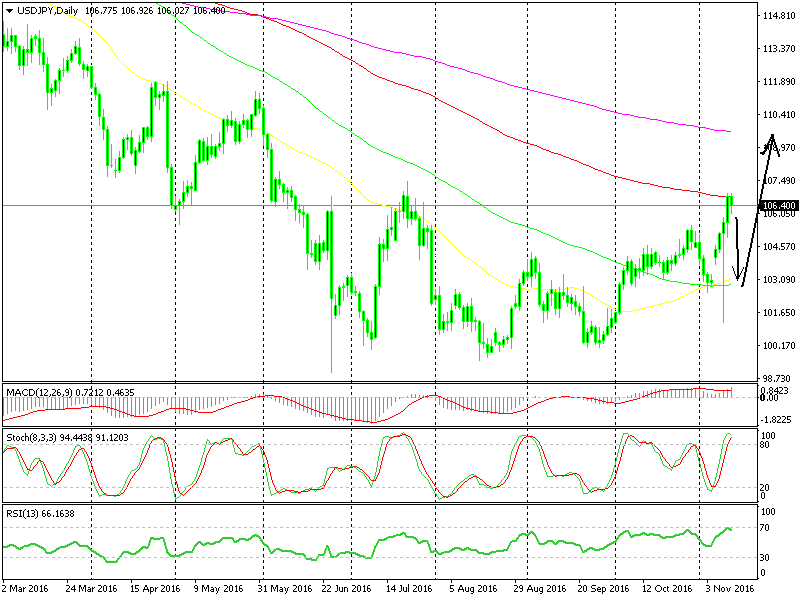
Can the price retrace to the green SMA?
Personally, I would love if the price retraced to the 100 SMA on the daily chart which is hanging around the 103 level. By that time, the stochastic and the RSI indicators that now are overbought would reach oversold levels, which would be perfect for a buy signal/trade.
However, there´s no such thing as a perfect setup or perfect trade in forex, so we must force ourselves into this trade. As I said above, the recent behaviour of this forex pair only points up, but I must find an entry point. Any ideas anyone?
- Check out our free forex signals
- Follow the top economic events on FX Leaders economic calendar
- Trade better, discover more Forex Trading Strategies
- Open a FREE Trading Account


