Tuesday Morning Technical Levels – USD/JPY
Following this morning´s EUR/USD flash analysis, we will continue with the technical analysis process, this time for USD/JPY. By the way, I already conducted a technical analysis of this forex pair, but some gremlins in my PC stole it because I can´t find it anywhere, so here we go again.
Which are the support and resistance levels that can define the risk if we decide to trade USD/JPY today?
 Get ready to buy because the retraces have been very shallow recently
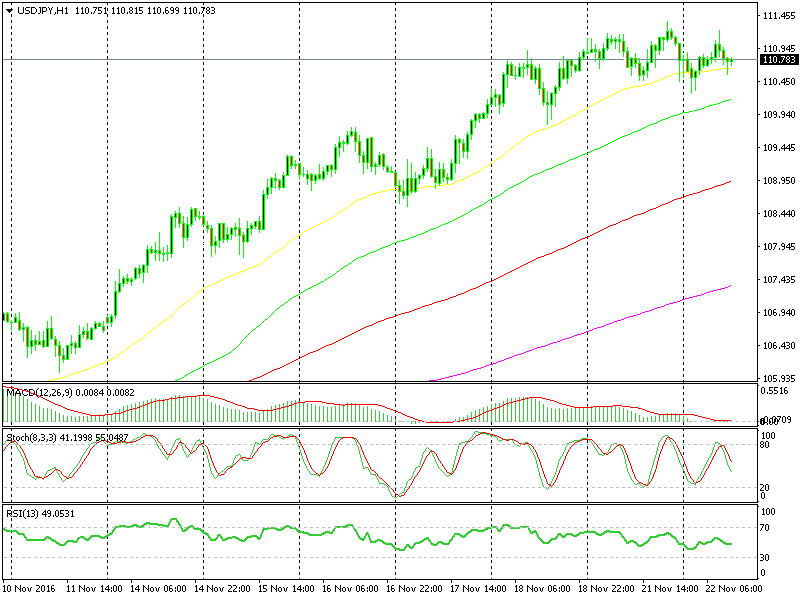
USD/JPY – We just issued a get ready to buy USD/JPY signal a few moments ago so let's start from the bottom. The first support level in this forex pair is provided by the 55 exponential moving average (55 EMA) on the H1 chart and the 20 simple moving average (20 SMA) in the H4 USD/JPY chart. Both of them stand around 110.55-65, so that´s the first line of defense. As in our previous update, I´m itching again to open a buy forex signal down here, but we´ll be a bit more reserved with this signal since we already opened a EUR/USD signal.
You can see the 100 SMA in green as the second line of defense below, coming at 110.15, so I expect the area between 110.00 and 110.15 to provide some sort of support in case USD/JPY sellers charge in. If you look at the daily chart, the only decent technical indicator nearby is the 200 SMA in pink which comes around 109.70, so that is the third defensive level for USD/JPY buyers.
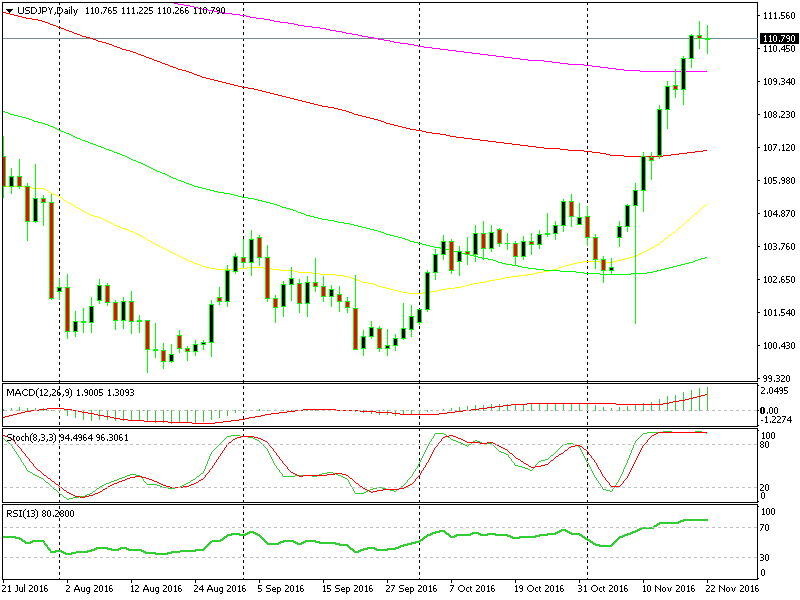 The 200 SMA is the closest technical indicator on the daily chart
On the top side, the round levels are always some kind of obstacle, obviously, give or take a few pips, but the 111 level in this forex pair is a decent resistance level. It stopped the hectic decline in the first few months of this year during that panic period in the financial markets, so it´s a long term support/resistance level.
The next resistance level comes at 1120-30, which has been the high during this recent uptrend. These are the only two resistance levels in USD/JPY until 115, because the price has been trading below the 110 level for nearly a year, so it will take some time for the rest of the technical indicators to catch up with the price.
By the way, if the price gets close to the 50 SMA in the H1 chart, maybe around 110.50-60, then I´ll pull the trigger on this one as well.
- Check out our free forex signals
- Follow the top economic events on FX Leaders economic calendar
- Trade better, discover more Forex Trading Strategies
- Open a FREE Trading Account
- Read our latest reviews on: Avatrade, Exness, HFM and XM
Related Articles


Sidebar rates
Related Posts
