USD/JPY – The First Line of Defense Is Gone
Last week, we opened a long term forex signal in USD/JPY which brought us more than 100 pips after closing it manually. We also gave a couple of trade ideas for this forex pair, so if you have utilised them properly, then you must have made some nice profit.
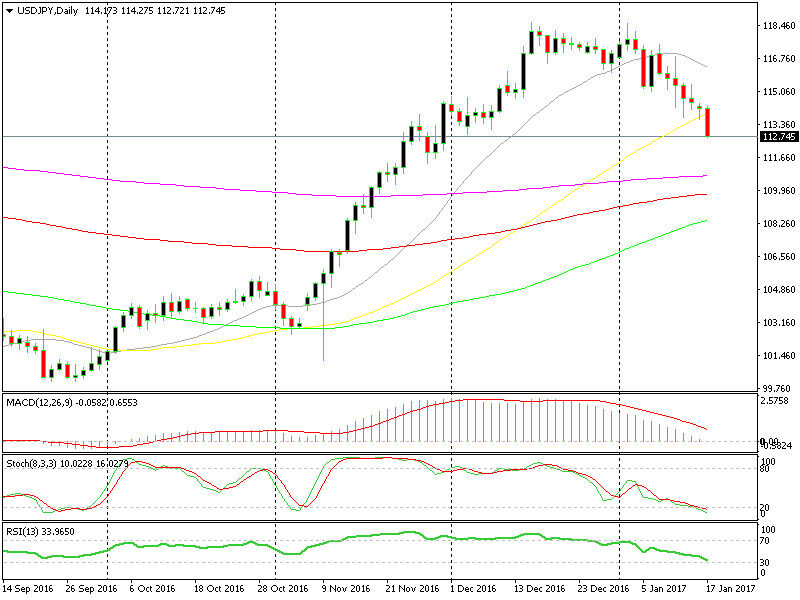
But this pair continued to slip lower yesterday until it reached the 50 SMA in yellow. At around 1 am GMT last night, I took another look at the daily USD/JPY chart and came to the conclusion that it was time to open another long term buy forex signal here.
 The 50 SMA in yellow fell as a martyr.
Our goal was to reach the 20 SMA in grey in the daily forex chart above.
There were four main reasons for this forex signal.
1. The long term trend is up.
2. The daily forex chart is extremely oversold, with both stochastic and RSI oversold.
3. The price was just above the 50 SMA in yellow.
4. Yesterday´s candlestick closed as a pin, which signalled a possible reverse.
Four important technical indicators pointing up are more than enough for a trade, but the forex market doesn´t always agree with your analysis. Another wave of USD selloff has unfolded today, so the price is about 100 pips lower now, but I´m positive we will see the Buck reverse if Trump doesn´t shoot it in the leg on Friday.
- Check out our free forex signals
- Follow the top economic events on FX Leaders economic calendar
- Trade better, discover more Forex Trading Strategies
- Open a FREE Trading Account


