112.50, Now You See It, Now You Don’t
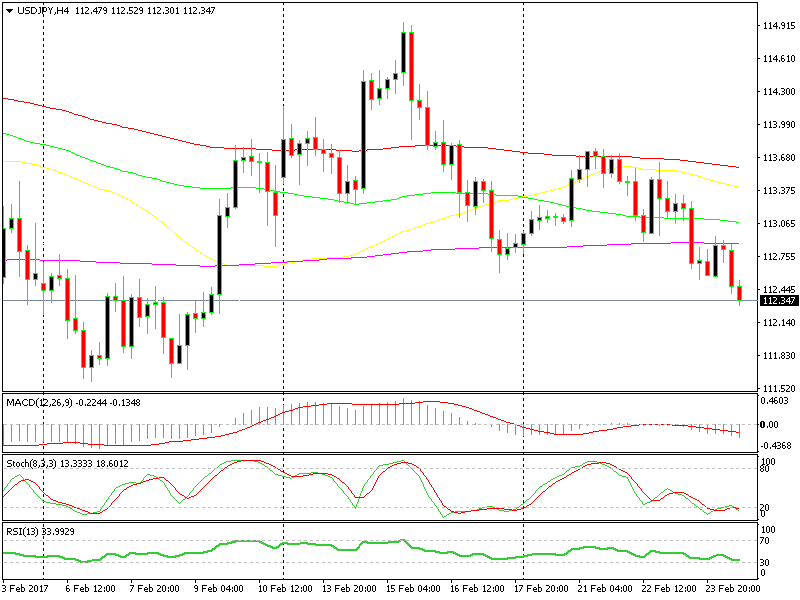
You remember our market update yesterday about USD/JPY? We briefly talked about how the 112.50 support level was under threat from sellers of this forex pair. We´ve seen it provide solid support last Friday and again yesterday, but it can´t resist this selling pressure forever.
The more the price knocks on a support/resistance level, the weaker it gets, particularly when the pullbacks get smaller and smaller. This means that the buyers are losing confidence, since they are unloading their long positions closers and closer to the entry price.
 The 112.50 level gave up
If we look at the H4 forex chart, we can see that the 100 SMA in red was where the buyers were unloading their positions at the beginning of the week, which comes at around 113.60-70.
Then, the 200 smooth moving average, in pink. which comes about 80 pips lower, turned into the unloading level. So, that´s the reason we didn´t open a long term buy forex signal at this level. 111.50 is now the next target where we might be lured to go long on this forex pair, but let´s wait until get there first.
- Check out our free forex signals
- Follow the top economic events on FX Leaders economic calendar
- Trade better, discover more Forex Trading Strategies
- Open a FREE Trading Account
- Read our latest reviews on: Avatrade, Exness, HFM and XM
Related Articles

Sidebar rates
Related Posts
