USD/JPY Still on the Slide – When Do You Think It’ll Be the Right Time to Go Long?
USD/JPY continues to slide since the FEDs hiked interest rates last Wednesday but failed in convincing the forex market that they saw more positives than negatives in the US economy. Perhaps this was done intentionally to keep the Buck subdued.
If you look at a small timeframe forex chart (H4 for instance), the picture shows a steep downtrend. However, looking at the daily USD/JPY chart, we see that we´ve been trading, more or less, in a range over the last three months.
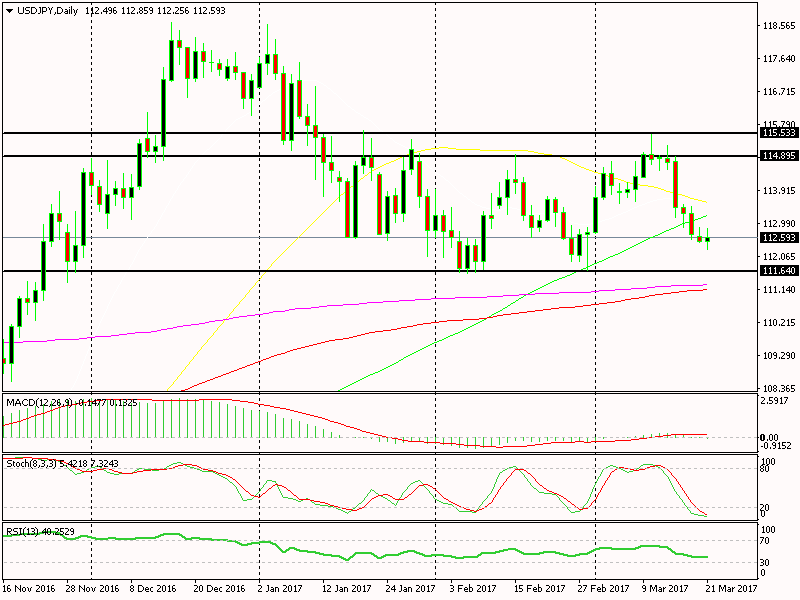 We´re still about 100 pips above the bottom of the range
The range stretches from 111.50s to 115 and 115.50s, which means that it is about 400 pips wide. Right now we´re edging closer to the bottom of the range, so we must seriously consider going long soon.
The stochastic indicator is totally oversold and RSI is getting there fast, so they´re signalling a possible reverse soon. We have to minimize the risk and maximize the potential profit, so I´d feel a lot better if I opened a buy forex signal around 111.50.
The stop loss would be below the two moving averages which are standing below that support level, so the potential loss would be minimal. On the other hand, the potential profit would be around 350 – 400 pips. As it is right now, if we pulled the trigger, the stop loss and take profit would be about the same.
Besides that, the weekly chart looks a bit bearish, particularly since last week´s candlestick closed as an engulfing bearish candle.
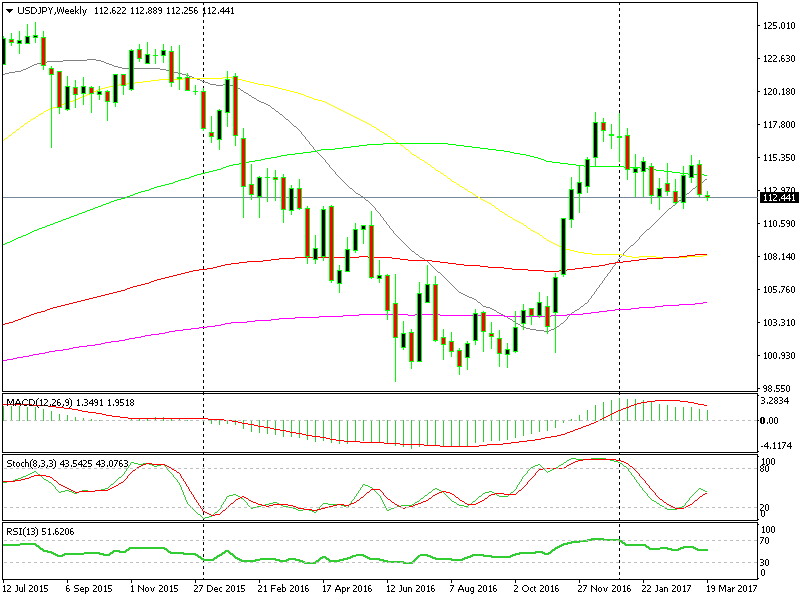 Last week´s bearish engulfing candle looks a bit scary to buyers
By the way, Bank of Japan is on our side; people expected them to be sort of hawkish, but they kept the status quo regarding monetary policy and didn´t give us any hawkish signs last week.
So, it´s the Dollar side which has me worried. But, we have to trade at some point and the 111.50 is the right level. We´ll still have to watch the price action when/if we do get down there and do a last minute re-evaluation.
- Check out our free forex signals
- Follow the top economic events on FX Leaders economic calendar
- Trade better, discover more Forex Trading Strategies
- Open a FREE Trading Account
- Read our latest reviews on: Avatrade, Exness, HFM and XM
Related Articles

Sidebar rates
Related Posts
