On Monday, the overall market is facing thin volatility as most of the investors are already out of the market after having major trades on Friday. Consequently, the Oil is also consolidating in a small trading range of $52.22 – $52.60.
Although, we are lacking trading volume, but still the crude oil has made its move higher at $52.56, adding +0.71% for the day. Investors are still concerned about the missile strike by U.S. forces in Syria, boosting the of conflict with Syrian supporters Russia and Iran. You must be thinking why Syria is important to move the oil prices. Well, it's because of the oil reserves. Though it's not at the top of a list, but definitely makes an influence on the Oil prices.
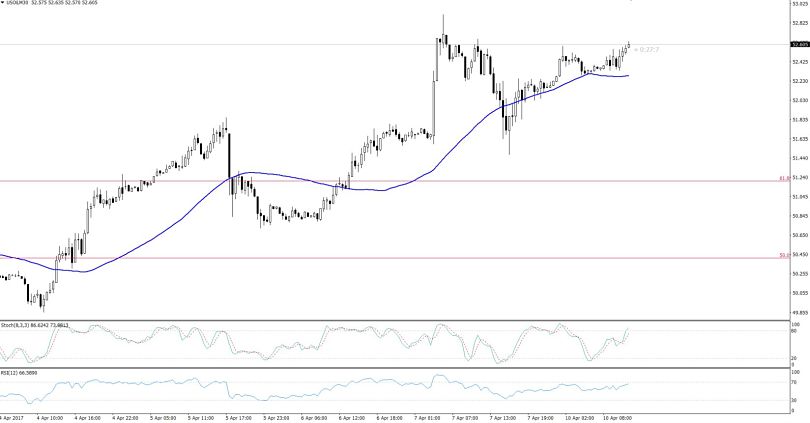 WTI Crude Oil – Hourly Chart?
Technical Outlook – Intraday
Let me highlight some technical aspects of the WTI crude oil.
- Firstly, the oil is trading bullish above 50 periods EMA which is extending it a support around $50.25.
- Secondly, the RSI (relative strength index) is holding above 50. Whereas, the above 50 value demonstrates are bullish sentiment instruments.
- Thirdly, if we look at the hourly chart of the WTI Crude oil, we can find an ascending triangle pattern which is sharing a resistance at $52.75 and support at $50.20. However, the ascending triangles are mean to break upside.
Forex Trading Idea
I have entered a buying position at $52.60 with a stop loss below $52.30 and a take profit at $52.85. Let's wait for the volatility for having further clues about the market behavior.