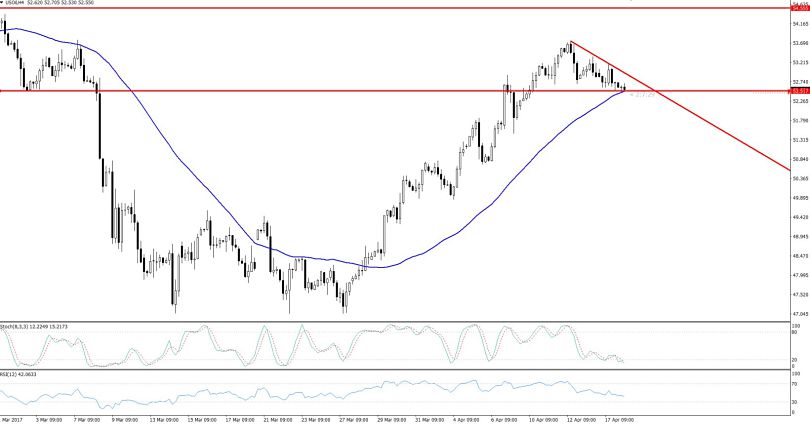
Bearish Breakout In WTI Crude Oil
In our previous update on the WTI Crude Oil, we discussed a descending triangle pattern in an hourly timeframe. We suggested that it’s likely to breakout in the early Asian sessions today. Though the breakout came a bit late, it definitely helped us in achieving our targets.
Today, the U.S. government drilling figures revealed that shale production in the month of May is expected to grow to 5.19 million barrels per day (bpd). This would bring the U.S. shale production up to a record high of 2.36 million bpd.
On the other hand, the UAE's (United Arab Emirates) energy minister tried to support prices by commenting that he expects a large oil demand which may cause a drop in the inventorry figures.
These pieces of news are opposite in nature. One is giving bullish support while the other is proving a bearish trend in the WTI Crude Oil. The technicals played their role in giving us a good forex trading signal.
 Crude Oil – 4 Hours Chart
Technical Outlook
Looking at the hourly chart, we can see that the price has come out of a descending triangle pattern which previously was extending support to the crude oil at $52.65. The RSI has already crossed below 50 and along with the 50 periods EMA, this signals a selling bias. Lastly, the breaking of the descending triangle pattern is likely to lead the oil towards $52.15 and $51.90.
We have already archived our initial take profit at $52.20 by selling below $52.55. Now, I'm looking to add further selling only below $52.10 with a stop loss above $52.35 and a take profit at $51.85.
- Check out our free forex signals
- Follow the top economic events on FX Leaders economic calendar
- Trade better, discover more Forex Trading Strategies
- Open a FREE Trading Account


