Support & Resistance Levels For USD/JPY
Ok, we´re back to the USD/JPY forex pair again. We can´t help it though seeing as the price has risen almost 150 pips over the last two days. Support and resistance levels have risen since the last time we took a look at the levels for this pair.
Let´s see where these levels stand right now, in order to spot the areas where we might open a buy/sell forex signal.
USD/JPY
Resistance Support
1 – 113.85 (mild – the high today) 1 – 113.30-40 (mild – yesterday´s high and 20 SMA on H1 chart)
2 – 114 (medium) 2 – 113 (medium – last week´s high and 50 SMA on H1 chart)
3 – 114.50-60 (mild) 3 – 112.80 (mild 20 SMA on H4 chart)
4 – 115 (strong) 4 – 112.20 (strong 50 SMA on H4 chart)
 Up and up we go
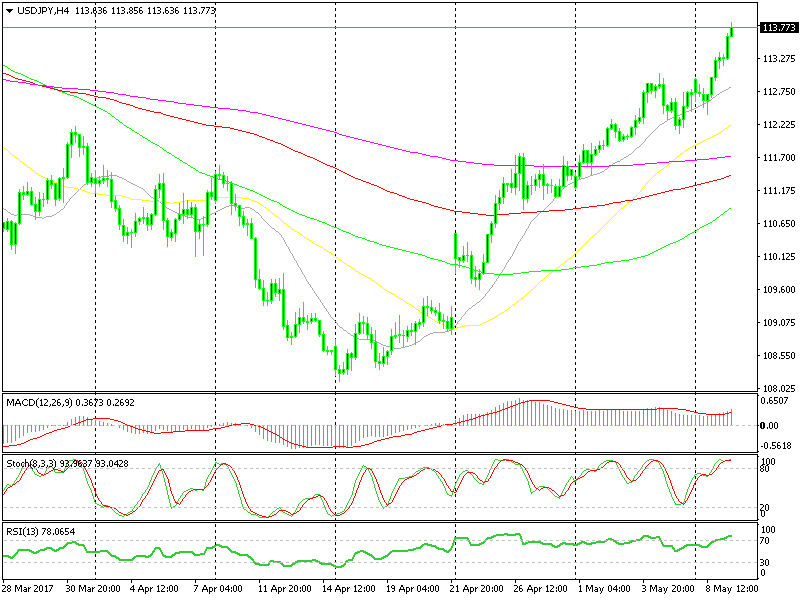
These are the closest support & resistance levels for USD/JPY which will support our trades in this pair. Although, as mentioned in the previous update, buying dips is the safer option right now.
- Check out our free forex signals
- Follow the top economic events on FX Leaders economic calendar
- Trade better, discover more Forex Trading Strategies
- Open a FREE Trading Account


