Forex Signals Brief for May 17th – U.S. Dollar On A Sinking Ship


Yesterday, the global financial markets encountered highly volatile sessions. Unfortunately, our Forex Trading Signal on the Gold and WTI Crude Oil were disappointing and they closed at the stop loss. However, on the bright side, we closed our Nikkei in profit.
Though most of the volatility was highly anticipated, what happened yesterday with the U.S. dollar was completely unexpected. As we discussed in our previous Forex Signals Brief for May 16th – Time To Ride The Volatile Market, the Euro hit the take profit at $1.10. Things were going as planned until news spread that U.S. President Trump may have shared intelligence with Russia's foreign minister about an Islamic State operation. This caused investors to suddenly switch to the haven assets and as a consequence, the dollar prices fell compared to peer currencies.
Undoubtedly, these sorts of fundamentals are totally unavoidable and spoil even the best-planned trades. That's what happened with our forex trading signal. Fortunately, we stopped out, as the market is now far away from our entry points.
Major Economic Events To Watch Today
AUD
- Wage Price Index q/q (2:30)
GBP
- Average Earnings Index 3m/y (9:30)
- Claimant Count Change (9:30)
- Unemployment Rate (9:30)
EUR
- Final CPI y/y (10:00)
CAD
- Manufacturing Sales m/m (13:30)
USD
- Crude Oil Inventories (15:30)
EUR/USD – The Pair With Solid Gains
The single currency Euro remained the chief beneficiary yesterday as it edged higher to trade a near 6-month high ($1.1115) against the U.S. dollar. As discussed above, the major reason was the latest news from Donald Trump. He never misses a chance to sink the U.S. dollar.
Besides this, the Eurozone GDP (Gross Domestic Product) gave investors another reason to stay bullish on the Euro. GDP gained 0.5% in Q1 of 2017 which is in line with the preliminary figures published earlier in the month of May.
As we know, the GDP is considered one of the most significant economic events. It is closely monitored by the central banks and they often use it to decide on policy decisions. This sparked speculation over the continuous European Central Bank’s (ECB) stimulus program. The sentiments of the hawkish ECB are underpinning the Euro.
Forex Trading Signal
Considering the market situation, the rough idea is to sell the EUR/USD at $1.1135 with a stop loss above $1.1165 and a take profit of $1.1060 & 1.1015.
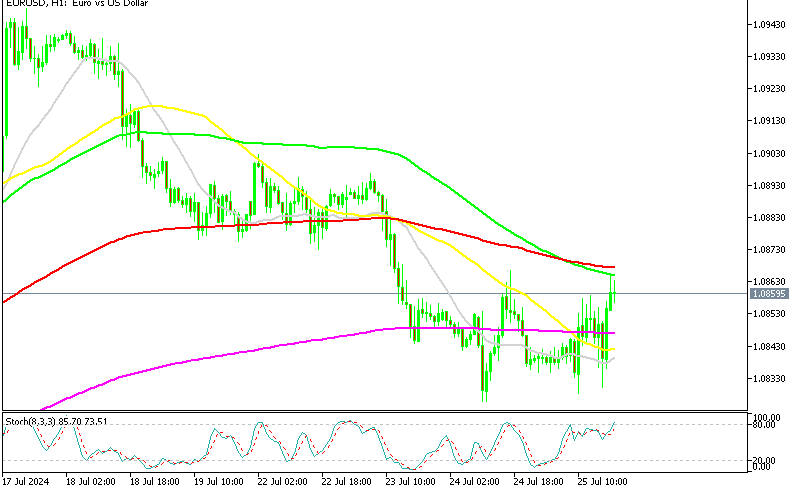
 EURUSD 4 – Hour Chart
.jpg) EURUSD 4 – Hour Chart
EURUSD 4 – Hour Chart
Technical Outlook – Intraday
Though we can't ignore the strong bullish momentum of the EUR/USD, for now, the pair has entered the overbought trading zone. Both of our momentum indicators, the RSI & Stochastic are trading above 70 & 80 respectively, demonstrating that sooner of later we may see a retracement.
On the daily chart, the pair can find a major hurdle at $1.1135 and, potentially, this is the first spot where buyers will think of taking profits.
Support Resistance
1.1003 1.1128
1.0925 1.1175
1.0878 1.1253
USD/JPY – Japnese Yen Glows On Haven Demand
Just like the Euro, the Buck fell sharply against the Japanese Yen. We have seen solid gains in the JPY, especially after the news release that U.S. President Donald Trump shared sensitive information with Russia's foreign minister.
Moreover, the greenback came under additional selling pressure after the release of U.S. housing starts revealed a slowdown in U.S. housing market recovery.
Forex Trading Signal
Today, the idea is to catch the retracement in the USD/JPY. Therefore, I will be waiting for the market to test $112.150 level to enter a buy position to target $112.750.
USDJPY – 32.8% Retracement Hourly Chart
.jpg)
Technical Outlook – Intraday
On the hourly and 4-hour chart, the Japanese Yen has entered into oversold territory but we can't expect a retracement until the USD/JPY gains support. The RSI is still holding below 20 along with the Stochastic, which is also demonstrating a solid bearish trend in the pair.
However, USD/JPY is likely to find a support at $112, the double bottom level, which can be seen in the 4-hour chart. Surprisingly, the USD/JPY is likely to complete 38.2% Fibonacci retracement at $112. This makes this level more reliable.
Support Resistance
112.35 114.33
111.38 115.34
110.37 116.31
Ending Remarks
Today, most of the currency pairs are trading in overbought/oversold areas. This means we can expect corrections in the market. The economic calendar doesn't have much to offer us, which means investors are likely to trade the previous sentiments.