Forex Signals Brief For June 5th – 11th, A Good Week To Trade Technical Levels
In the previous week, the dollar was hit massively by sellers and fell dramatically to close the week at new lows for the year. As a consequence, the investors turned to the bullion market and the dollar peer currencies.
The solid fluctuations in the prices were triggered in response to the U.S. Non-farm payrolls, which increased by 138K for the month of May. However, the figure was well below the forecast gain of nearly 185K for the month.
Despite the cracking NFP figures, we can't ignore the unemployment rate. Considering April’s decline to a 10-year low, honestly, I wasn't expecting another dip in the figure. The rate surprised me and the market by falling further to 4.3% for the month.
Just like the previous week, the current week doesn't promise to be an important week for fundamentals. Hence, we should focus on the technical trading levels and collaborate them with the fundamental decisions. However, there are only a few macroeconomic events that are likely to stand out this week.
The Week Ahead – What To Look For?
USD
- Revised Nonfarm Productivity q/q (Monday – 12:30)
- ISM Non-Manufacturing PMI (Monday – 14:00)
- Factory Orders m/m (Monday – 14:00)
- JOLTS Job Openings (Tuesday – 14:00)
- Crude Oil Inventories (Wednesday – 14:30)
- Unemployment Claims (Thursday – 12:30)
EUR
- Minimum Bid Rate (Thursday – 11:45)
- ECB Press Conference (Thursday – 12:30)
GBP
- Services PMI (Monday – 8:30)
- Halifax HPI m/m (Wednesday – 7:30)
- Parliamentary Elections (Thursday – All Day)
- Manufacturing Production m/m (Friday – 8:30)
- Goods Trade Balance (Friday – 8:30)
CAD
- Ivey PMI (Tuesday -14:00)
- Building Permits m/m (Wednesday -12:30)
- NHPI m/m (Thursday – 12:30)
- BOC Gov Poloz Speaks (Thursday -15:15)
- Employment Change (Friday – 12:30)
- Unemployment Rate (Friday – 12:30)
AUD
- Company Operating Profits q/q (Monday -1:30)
- Current Account (Tuesday – 1:30)
- Cash Rate (Tuesday – 4:30)
- RBA Rate Statement (Tuesday – 4:30)
- GDP q/q (Wednesday – 1:30)
- Trade Balance (Thursday – 1:30)
JPY
- Final GDP q/q (Wednesday – 23:50)
EUR/USD – The Overbought Currency Pair
The single currency Euro appreciated and gained nearly three-quarters of the 0.7%. This happened partially due to the unexpected U.S. labor market report.
This week, we are expecting updates from the ECB. They are likely to release the interest rate decision in the forthcoming policy meeting. ECB President Mario Draghi is likely to base any rate decision on the economic events, and specifically the inflation figures, which fell from the high levels since 2013 at 1.2% to 0.9%.
In addition to the ECB Minimum Bid Rate, we also have the press conference. Investors will be looking for clues about the beginning of the end of the QE. Any hawkish comment will definitely push the pair even higher, but dovish remarks will hit Euro harder.
Forex Trade Idea
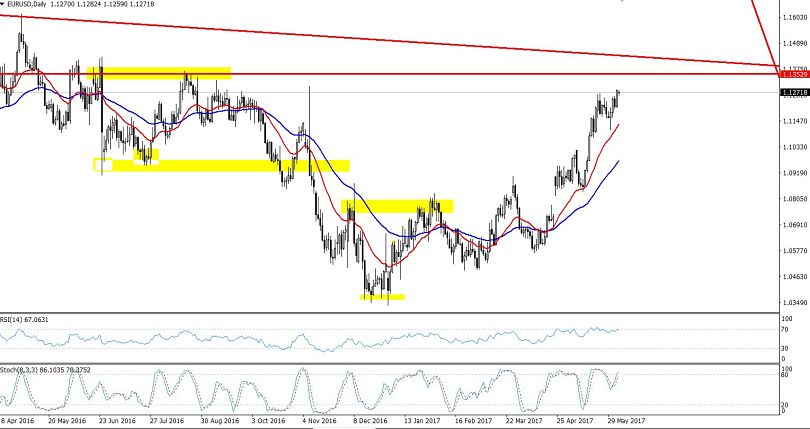
During this week, $1.1100 is a crucial trading level. The rough trading idea is to have a buying position above $1.1100 with a target of 1.1345 and $1.1425.
 EUR/USD Daily Chart – Double Top Pattern
Technical Outlook – Weekly
Looking at the weekly chart, the EUR/USD plunged dramatically in the first week of June and formed a bullish engulfing candlestick pattern. This demonstrates investors' intentions to stay on the buying side.
However, the EUR/USD is trading in the overbought territory as the momentum indicators (RSI = 65) are demonstrating investors' significant bullish sentiment.
I will be more than happy to sell the EUR/USD, but only upon the breakage of this particular support level of $1.1200. At the breakage bellow, this level will open further room for selling until $1.1100 and 1.1015.
Support Resistance
1.1148 1.1265
1.1117 1.1350
1.1074 1.1432
USD/JPY – Symmetric Triangle Pattern
The USD/JPY was also one of the major movers in the market. The pair traded sharply bearish on Friday, as it was already under pressure early in the week over the news of another missile test by the North Korea.
As we know, the Japanese yen attracts investors during times of trouble, even if the problem is outside Japan. But later, the pair fell with double the speed due to weakness in the U.S. dollar upon the release of the depressing Nonfarm Payroll figures.
The important point is that the USD/JPY broke out of its well-maintained trading range of $110.850 – $112.200.
Forex Trade Idea
Just like EUR/USD, the $111.600 is a crucial trading level for the week. Therefore, I recommend staying in a sell position below this trading level. The initial take profit will be $110.00 and then $109.750
 USD/JPY – Symmetric Triangle Pattern 4-Hour Chart
Technical Outlook – Weekly
In daily time frame, the USD/JPY has dropped below the 61.8% Fibonacci retracement of $110.550. Aside from Fibo level, the pair has also broken below a double bottom support level as it pulled-back back higher on May 18th. BThe breakage below $110.450 level is likely to add further room for selling until $110.050.
At the moment, the pair is trading below a 50- periods moving average, which is extending a strong resistance at $111.500. The prices below the moving average demonstrate traders' selling bias. We also need to look out for the sell opportunities ahead.
Support Resistance
109.93 111.31
109.43 112.19
108.55 112.69
Conclusion
On the first trading day of a fresh week, the market is likely to "price in" the upbeat unemployment rates. Whereas, later this week, the focus will be on the U.K.'s Parliamentary Elections along with Minimum Bid Rate and ECB Press Conference, which are likely to extend a trend to the muted market. Keep following us for the fresh Forex Trading Signals!


