Anyone Taking The AUD/USD Short Trade?
Yesterday we opened a sell forex signal in AUD/USD. It was a quick decision, if you had a look at different timeframes of this forex pair yesterday you wouldn´t take long either.
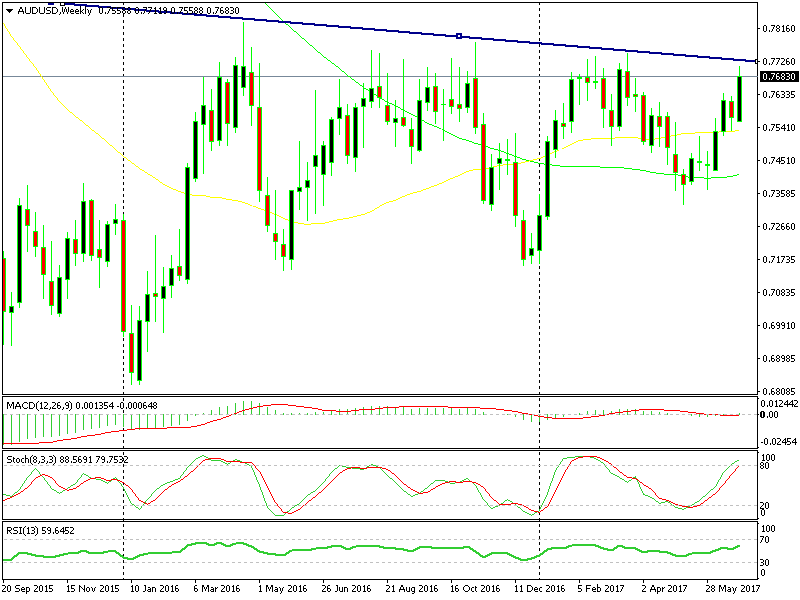
 The ascending trendline is standing just above our heads
The charts are still the same today:
- On the daily chart, Stochastic and RSI are both overbought
- It´s still early, but the daily candlestick right now looks like a doji, which means reversal
- On the weekly chart, stochastic is overbought
- The ascending trendline which started a year ago is providing resistance at the moment
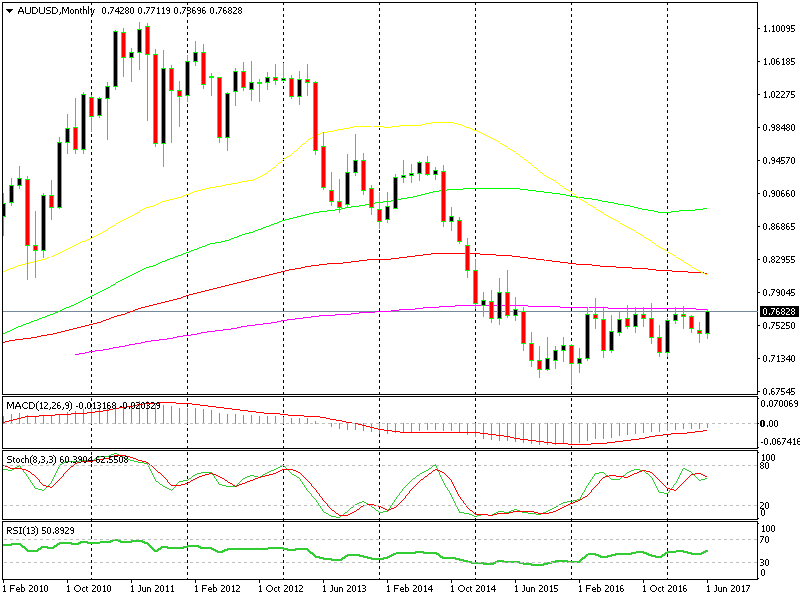
- On the monthly chart, the 200 SMA (purple) has been providing solid resistance for more than a year as you can see from the chart below. It´s likely it will do the same now, isn´t it?
These are all technical indicators strongly pointing down for this forex pair, even though the trend is up on the daily chart.
But the picture in higher timeframe charts is different; the bigger trend is still down. According to forex textbooks, this is merely a pullback before the next leg down.
Although, the main reason for our long term forex signal here is the USD weakness over the last month. The Buck has lost a big chunk of its value since the beginning of the year and particularly over the last 6-7 weeks.
I think that a decent pullback lower is overdue, if not a continuation and extension of the downtrend. There are plenty of pips to be made on this trade, but 200 pips is enough as the first target. Then, if this forex trade progresses nicely in our favour, we will reconsider the take profit target again.
 The move higher this month is pretty strong, but so is the 200 SMA
New Instruments in Our Forex Signals Service
We’ve recently incorporated some exciting new financial instruments into our trading signals service -gold and crude oil. We will add more instruments soon, such as CryptoCurrencies, so keep an eye out for analysis on these new instruments.
- Check out our free forex signals
- Follow the top economic events on FX Leaders economic calendar
- Trade better, discover more Forex Trading Strategies
- Open a FREE Trading Account


