Before Buying USD/JPY, Hold on and Take a look at the Daily Chart
If you look at the H4 USD/JPY chart, you can see the steep uptrend that has evolved during the last 4-5 weeks. But today, the price is retracing lower, so we´re observing this forex pair to get a nice entry point.
The sellers had a go at the bottom side about a month ago and after failing to break or even reach 1.08 for the third time in a row, they finally gave up, that´s what the price action told us at that time.
The economic data has improved considerably during this time and a month later the confidence in the global economy has increased.
That has put the safe haven currencies under immense pressure. The Swissy has lost considerable ground, but the yen has been smashed to pieces.
So, you´d argue that buying dips would be the way to go with USD/JPY now. Right now, we´re at the 50-SMA (yellow) on the h4 chart, so why not go long right now?
Well, the H4 chart looks very appealing for buyers; it is oversold with stochastic and RSI indicators near the bottom of the range and the 50-SMA is providing support.
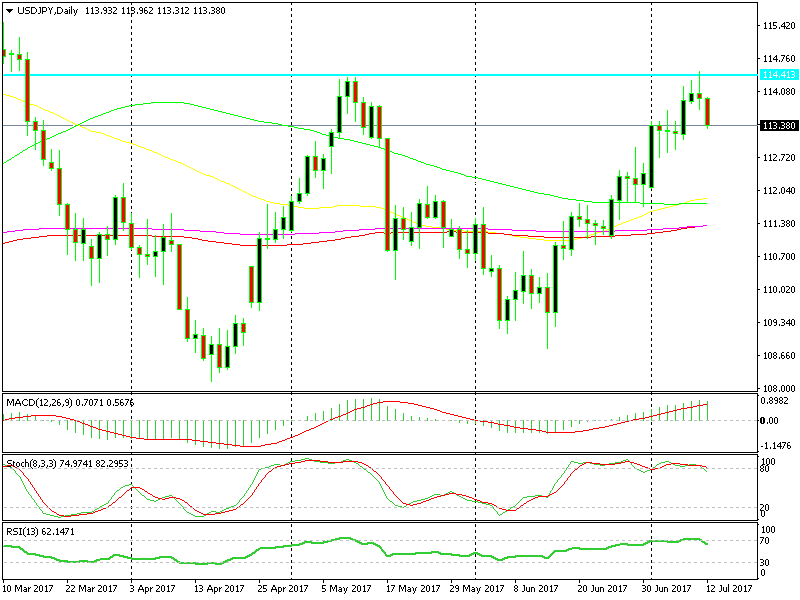
Given the relentless uptrend of the last month, you could as well pull the trigger now, but the daily forex chart is putting me off, to be honest.
 A bearish setup has formed on the daily chart
You can see that the 114.40 area is a long-term resistance; the price stalled right there and is now retracing lower. Besides that, yesterday´s daily candlestick closed as a doji, which is a reversal signal. So, a deeper pullback might be on the way.
In conclusion, I´m holding my chips right now and waiting for a more substantial pullback, probably until we reach the moving averages below, before making a decision.
New Instruments in Our Forex Signals Service
We’ve recently incorporated some exciting new financial instruments into our trading signals service -gold and crude oil. We will add more instruments soon, such as cryptocurrencies, so keep an eye out for analysis on these new instruments.
- Check out our free forex signals
- Follow the top economic events on FX Leaders economic calendar
- Trade better, discover more Forex Trading Strategies
- Open a FREE Trading Account


