Forex Signals Brief for July 19th – A Great Day For Technical Trading!
Unlike yesterday, I'm not expecting much from the fundamentals today. However, today, the technical levels will be the major catalyst for price movements.
The US dollar slipped sharply due to the Trump administration's lack of progress on the tax reforms. Even the low impact events played a role in dragging the buck downward. The National Association of Homebuilders (NAHB) index sank from 66 last month to 64 for the month of July. Surprisingly, this is the lowest figure since November 2016.
The BOE's governor Carney had been scheduled to speak during the US session. He was supposed to unveil the new plastic £10 note. Instead, it will be issued on September 14th. This didn't have any impact on the market.
Major Events To Watch
Since the market is lacking in economic events today, the average price movement is likely to remain limited.
US Dollar – Building Permits will be in the spotlight at 12:30 (GMT). These are expected to release higher than expected. Building permits show the yearly number of new residential building permits issued over the previous month. What does this have to do with the dollar?
Since acquiring a permit is amongst the initial steps in constructing a new building, it's considered an excellent way gauge future construction activity. Similarly, US Housing Stats are expected to release higher than the previous month's figure. They are forecasted to release at 1.20 million vs. 1.17 million last month.
Most importantly, the crude oil Inventories are due to be released at 14:30 (GMT). They are expected to release a figure of -3.6 million barrels draw which is lower than the previous week's draw of -7.6 million. I will share a detailed update about the release later on, but first, let's take a look at forex pairs.
EUR/USD – Bullish Channel In Play
Traders, as I shared in my previous updates on EUR/USD, the pair is showing a nice bullish trend. Yesterday, the pair broke higher during the Asian session and steadily moved toward trading a multi-years high. Investors jumped into the market upon the breakage of the $1.1500 resistance in order to secure their shares in EUR/USD.
Now, we need to wait until tomorrow to see some serious moves in the pair. Though the ECB is likely to keep the rate unchanged, any clues about tapering the bond buying will be enough to buy Euro.
Technically, EUR/USD is heading upward while maintaining a bullish channel on the 4-hour chart. The 50 periods moving average is supporting the pair at $1.1495.
At the moment, the pair is likely to rush for 23.6% Fibonacci trading level of $1.1530 and upon the breakage, it may test the 38.2% Fibbo at $1.1500. Are you feeling lost with Fibonacci trading? To find out more, read our Fx Leaders Fibonacci forex trading strategy article.
 EUR/USD – 4 Hours Chart – Bullish Channel

EUR/USD Trading Idea
We can stay in sell below $1.1560 to target the $1.1500. On the other hand, buying is recommended above $1.1470.
GBP/USD – The Bears Favourite
Unlike EUR/USD, the Cable traded bearish despite the weaker US dollar. This is because of the unchanged consumer prices.
The yearly inflation rate sank to 2.6% compared with a forecasted unchanged rate of 2.9%. The BOE heavily depends upon inflation stats to chose the next rate hike. Therefore, the weaker than forecasted inflation figures make it less likely that the BOE will tighten the monetary policy.
As of now, the GBP/USD is consolidating above the double top resistance/support level of $1.3020. Breakage of this level will help us target a quick 30 pips at $1.2970.
On the daily chart, we can see a spinning top candlestick pattern, signifying investors' neutral stance. However, this neutral bias is lead by the weaker dollar and fundamentally weaker Pound (Bad CPI). The pair has already completed 38.2% Fibonacci retracement at $1.3004.
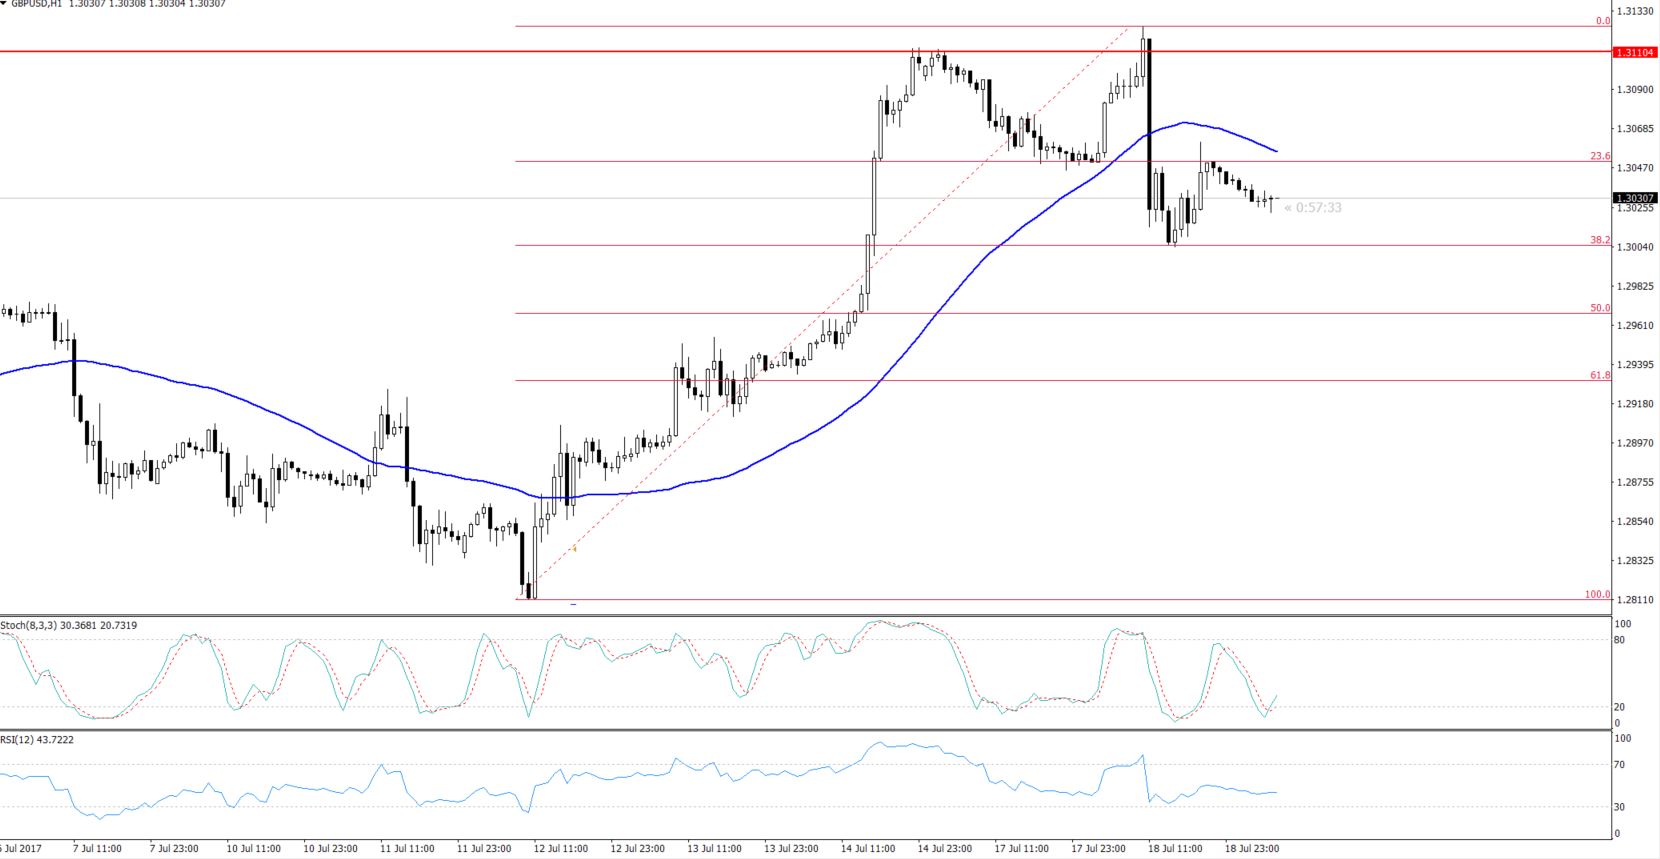 GBP/USD – Hourly Chart – 38.2% Retracement
GBP/USD Trading Idea
Now the game plan is simple; breakage of $1.3000 is likely to give us a quick sell until 1.2965 (30/40 pips). I'm not in favor of buying until the market completes 61.8% retracement at $1.2920.
Though the market may have thin trading volume today we are bound to see some action during the US sessions, particularly in the crude oil. In the meantime, feel free to peruse our detailed FX Leaders articles on how to trade the EUR/USD signals and how to profit from the USD/JPY signals. Good luck and get ready for the exciting forex trading signals ahead!
- Check out our free forex signals
- Follow the top economic events on FX Leaders economic calendar
- Trade better, discover more Forex Trading Strategies
- Open a FREE Trading Account


