Hanging Man In Gold – Can we sell again?
Gold traded exactly as I discussed in my previous update, helping us secure more than 40 pips before reversing to $1244. But, now the Gold is sliding below the same level of $1244 as the dollar is showing some support near its multi-month lows.
Okay, looking at the Gold chart, I don't see much difference in trading conditions. On the daily chart, both of the momentum indicators, the RSI and Stochastic are holding above 80 & 70 sequentially.
This signifies that gold is overbought and it may drop to complete a 23.6% Fibonacci retracement at $1233 and 38.2% retracement at $1228. But, we need to keep in mind the ECB monetary policy decision is still pending today, which may influence gold.
On the daily time frame, Gold formed a hanging man candlestick which is known for bearish reversals. In the absence of fundamentals, the market is surely a nice sell. To make more efficient decisions, refer to Fx Leader Candlestick trading strategy.
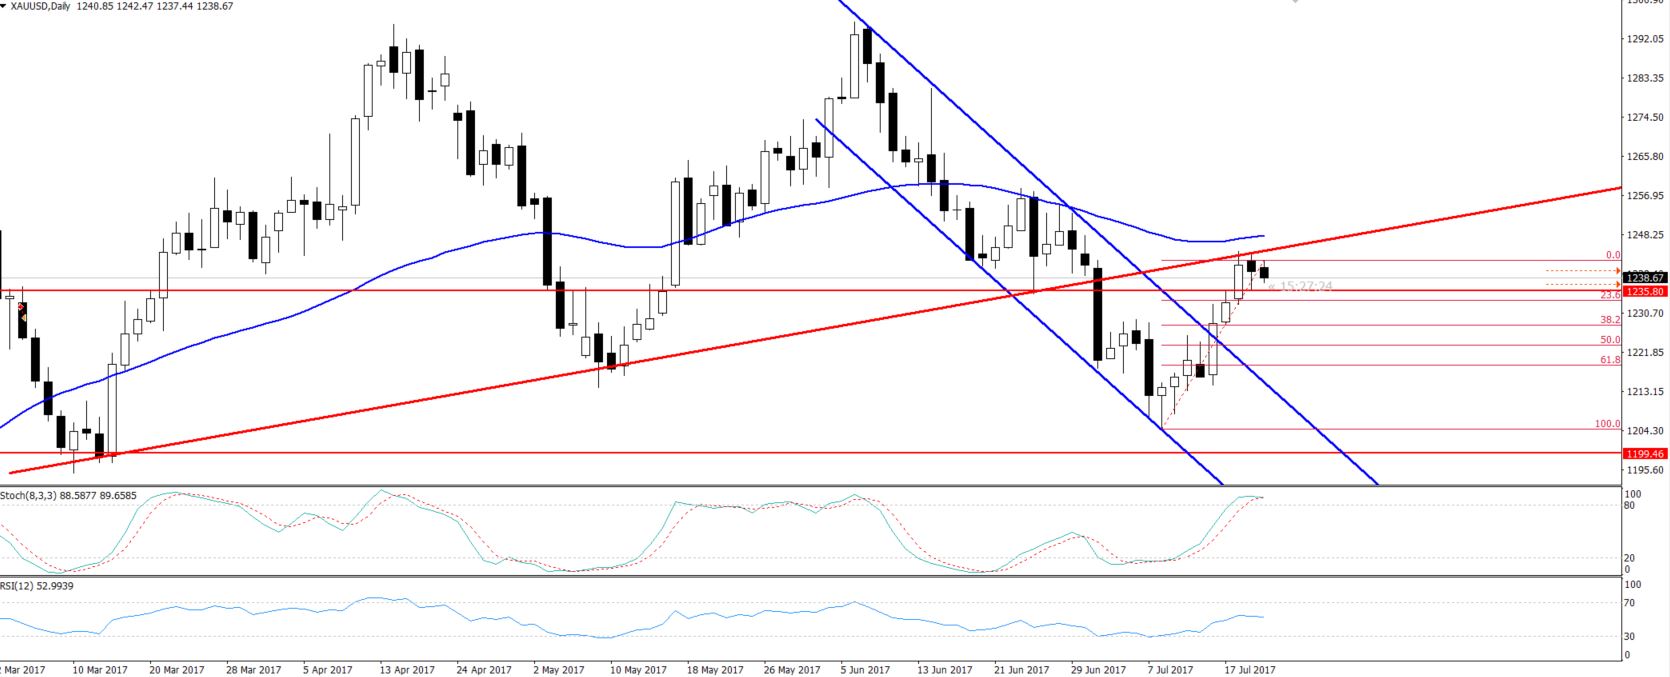
Gold – Daily Chart – Handing Man Pattern
Gold Trading Idea
I have opened a sell signal at $1238.50 with a stop loss above $1242 and take profit at $1235. Plan B is to enter a buy order at $1228. Alternatively, we need to keep in mind that $1244 is a major level, the breakage can make gold more bullish up to $1252.
- Check out our free forex signals
- Follow the top economic events on FX Leaders economic calendar
- Trade better, discover more Forex Trading Strategies
- Open a FREE Trading Account