Support & Resistance Levels For GBP/USD
Since we´re planning to trade GBP/USD, let's look at this pair´s support and resistance levels to see where to open a forex trade. In the previous forex update, we mentioned that we´re planning to open a sell forex signal either at the 50 SMA or the 200 SMA on the daily chart.
Let´s see if there are resistance levels coming at the same levels as the moving averages, in order to strengthen their position.
Resistance Support
1 – 1.3050-60 (Medium – Yesterday´s high) 1 – 1.3020-30 (Mild – buffer zone for 1.30, top)
2 – 1.30.80 (Medium – 200 SMA on H1 chart) 2 – 1.30 (Strong – No need to explain)
3 – 1.3100 (Strong – Big round number) 3 – 1.2970-80 (Medium – Buffer zone for 1.30, bottom)
5 – 1.3120-30 (Strong – 50 SMA on H4 chart) 4 – 1.2950 (Medium – Previous resistance)
 These are the sell levels, but I doubt we´ll see anything above the first line today
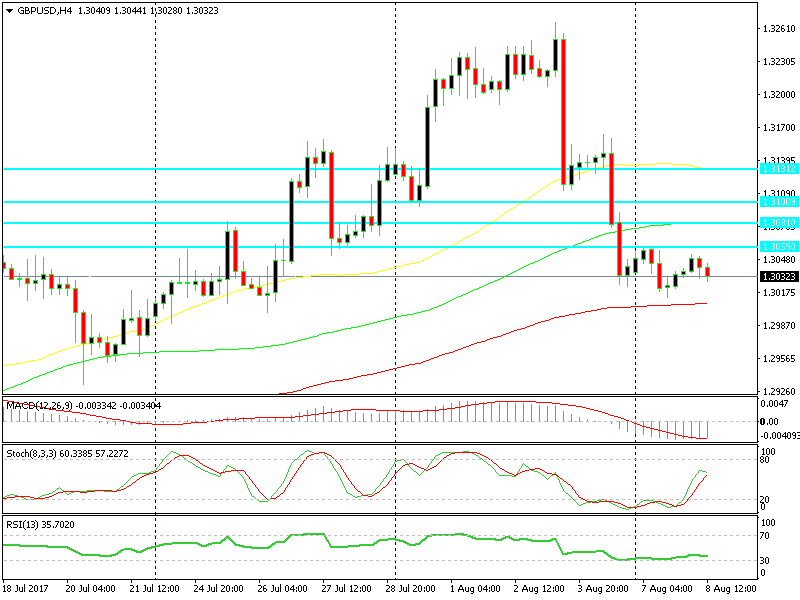
The 1.3050-60 level is the first resistance at the same level as the 50 SMA on the H1 GBP/USD chart. That area normally becomes a sell level, but the price has slipped to 1.3030s now.
Looks like GBP/USD is feeling quite bearish at the moment. All other major currencies are gaining against the USD, while GBP/USD has given back 20 pips. Our bearish bias towards this forex pair remains, although don’t forget that the market is extremely quiet and the ranges are pretty tight.
- Check out our free forex signals
- Follow the top economic events on FX Leaders economic calendar
- Trade better, discover more Forex Trading Strategies
- Open a FREE Trading Account


