NZD/USD Approaching TP
We opened this forex signal last Friday. The price was retracing higher after a 3-week downtrend and at the moment this signal is close to
We opened this forex signal last Friday. The price was retracing higher after a 3-week downtrend and at the moment this signal is close to our take profit target at 0.7202. Although, the chart setup doesn’t look too promising so we might have to close this signal manually.
 The 100 SMA is solid resistance
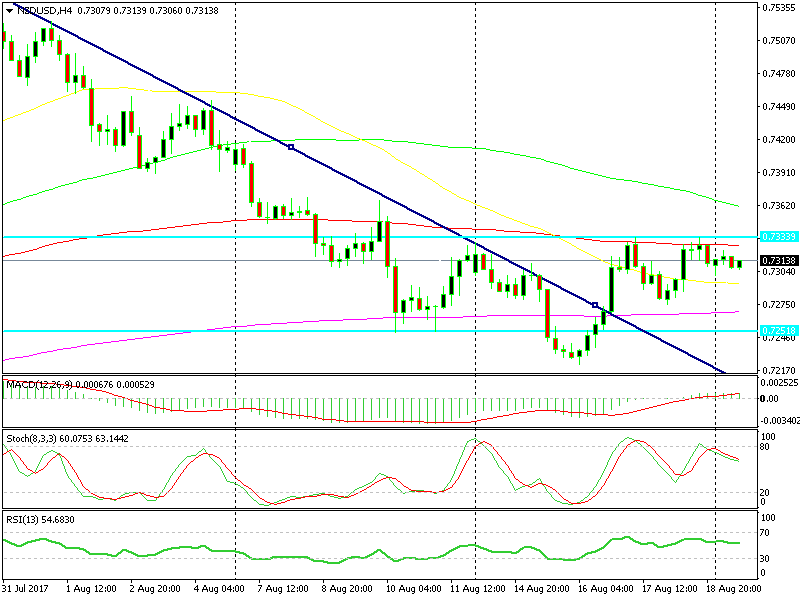
Looking at the H4 chart above, the entry level was pretty decent because it has been providing support and resistance previously, so it was likely to do the same this time too.
Besides that, the 100 SMA (red) was holding around 0.7330 and the stochastic indicator was overbought, which implies that the retrace is over.
We decided to open a sell forex signal there and it went well in the last few trading hours last Friday. It's still in a good position as I speak, although the price is playing games down here; it got close to TP by a few pips but missed it.
The 50 SMA is keeping the price from reaching TP
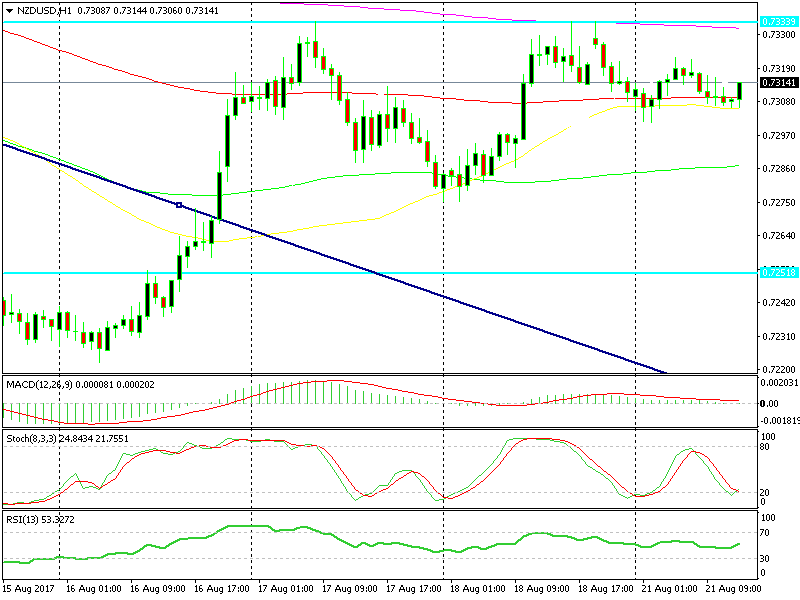
The H1 chart above doesn’t look good either. Stochastic is already oversold which means that the H1 chart is oversold. The 50 SMA (yellow) has been providing support all morning.
The last few candlesticks closed as dojis which are reversing signals and now the price is crawling back up. So we´re thinking of closing this forex signal manually: hopefully the price will climb back up to the resistance area where we can open another sell signal/trade.
- Check out our free forex signals
- Follow the top economic events on FX Leaders economic calendar
- Trade better, discover more Forex Trading Strategies
- Open a FREE Trading Account