Cashing in on EUR/GBP
Yesterday we opened a forex signal in EUR/GBP after this pair dived about a cent from the high a couple of days before.The hourly forex cha
Yesterday we opened a forex signal in EUR/GBP after this pair dived about a cent from the high a couple of days before.
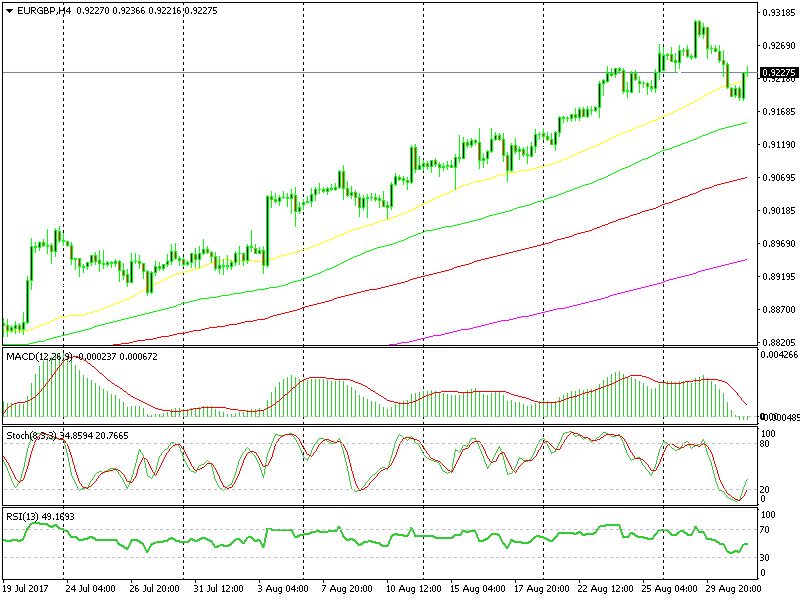
The hourly forex chart didn’t look great when we opened that signal, but the H4 chart looked better for longs. For starters, the uptrend is pretty visible on the H4 chart.
 We played the uptrend and it worked
When we opened the signal, this forex pair had completed a retrace lower and stochastic and RSI were both oversold on the H4 chart. So, we decided to buy this pair.
The 50 SMA (yellow) was another great technical indicator which was screaming buy at the time. Besides the uptrend, this moving average was one of the main reasons that we opened this signal.
It provided support over the last several weeks and it has kept the uptrend intact. It was broken for a short period but this morning the price got back above it and the uptrend resumed.
I think this latest climb higher is coming exclusively from this pair because the Euro is unchanged despite the Eurozone inflation report which came out slightly better than expected.
Anyway, whatever the reason, we got our pips and this was the chart setup that lured us to open the signal in the first place. Pretty straightforward, isn’t it?
- Check out our free forex signals
- Follow the top economic events on FX Leaders economic calendar
- Trade better, discover more Forex Trading Strategies
- Open a FREE Trading Account


