EUR/USD Fails at Breaking Resistance – Next Bearish Move?


EUR/USD broke and held the resistance level at 1.16 several days ago although buyers have tried to break at about 1.1620.
The EUR/USD traders couldn’t push higher either, so the 1.1615-20 area has now turned into decent resistance. This morning we saw the last attempt at breaking it, but again, without much success.
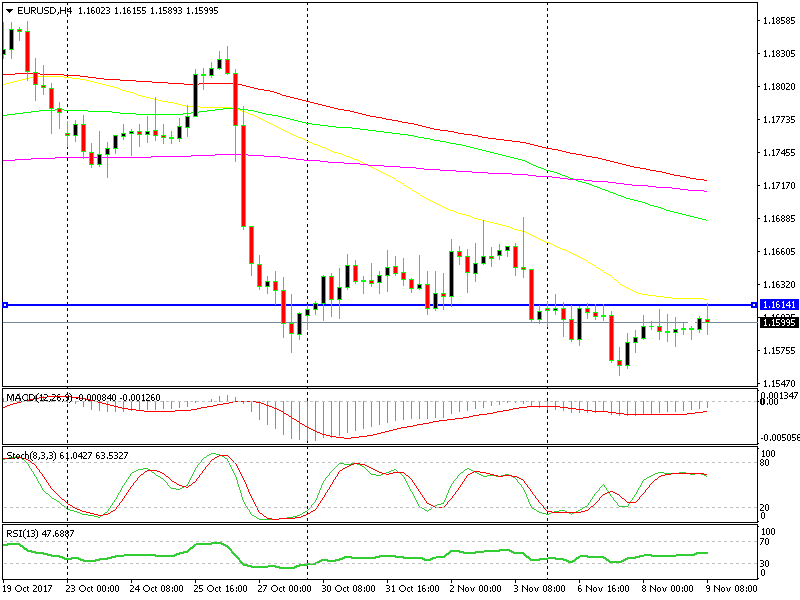
The resistance area and the 50 SMA are teaming up now.
As you can see from the H4 EUR/USD chart, this forex pair has been climbing higher this week, but that climb seems too weak for a reverse. I see this as just a retrace before the next leg down.
Also, you can see that this chart is almost overbought and the stochastic is turning lower.
Additionally, the 50 SMA (yellow) which has provided resistance last week has now caught up with the price and it is providing resistance again, together with the 1.1615-20 level.
I have heard whispers that this is the end of the decline for EUR/USD and that the upside will resume again. This could be right, but this chart shows that the sellers are building up before their next move lower.
The price action points south as well. Every jump above 1.16 has found strong selling interest and the jumps have been quite anemic. So, I think this pair will soon turn lower when it makes its mind up. I might be persuaded to open a sell forex signal today if EUR/USD gets close to 1.1620 again.