EUR/USD at Crossroads on Bigger Time-frames (Weekly & Monthly Charts)


The EUR/USD started reversing around two months ago after an eight-month uptrend but now it's at an important level. We were at this level a couple of weeks ago, but the stochastic indicator wasn’t really oversold then. Right now, it is extremely oversold on the weekly forex chart.

The weekly candlestick closed above the 100 SMA.
As you can see from the EUR/USD chart, EUR/USD closed last week at this long-term resistance level around 1.1660. It closed above the 100 SMA (red) which might turn into support with the moving average around 30 pips lower.
Besides the stochastic being oversold, the daily candlestick closed, which is hard to see because the candlesticks are small. The hammer candlestick may indicate that a retrace higher might follow.
It is possible that we see a retrace higher before the next move lower. In fact, some big names in the industry are calling for a bottom in this forex pair and of a resume of the uptrend which started in January. This may happen, but in my opinion, the downside is more at risk after a retrace higher if the buyers find the force to push up.
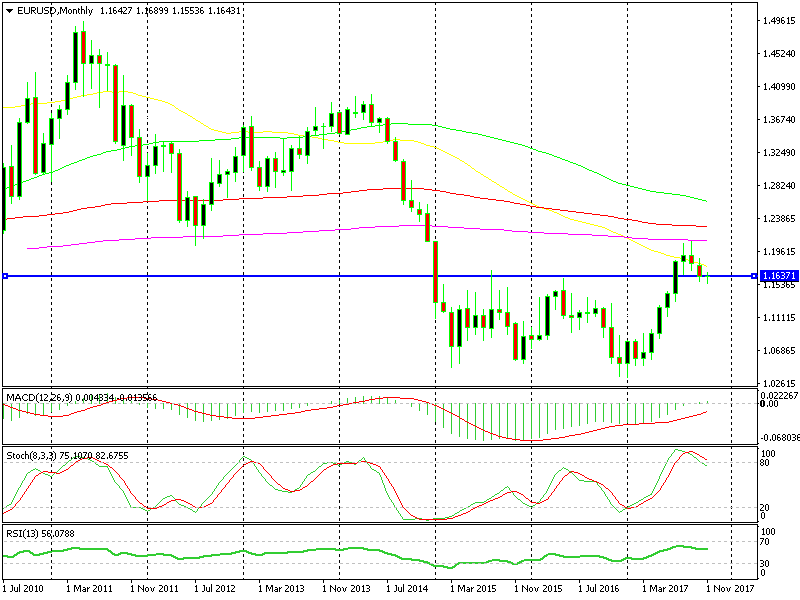
The monthly chart looks very bearish, but support is still valid.
The monthly forex chart is still overbought and heading down with plenty of room to decline, but this is a crossroad. We will have to wait and see how things evolve from here after observing the market in order to get a clearer picture.