Thanksgiving Holiday – Forex Market At A Standstill
Happy Friday, fellas. We made it through another remarkable week full of green pips. However, as expected, yesterday's trading sessions re
Happy Friday, fellas. We made it through another remarkable week full of green pips. However, as expected, yesterday's trading sessions remained quite. Most US traders are off to celebrate Thanksgiving. So, what should we expect from today's market? Let's find out below…?
Top Economic Events Today
Eurozone – EUR
German Ifo Business Climate – At 9:00 (GMT), the Ifo Institute for Economic Research will be releasing the German's Business Climate figures. This is a survey of about 7K businesses which asks respondents to rate the relative level of current business conditions and their expectations for the next 6 months.
For all the newbies out there, this is a leading indicator of economic health. Businesses react quickly to market conditions. Any changes in their sentiment can be an early signal of future economic activity such as spending, hiring, and investment. Regardless, these figures are not expected to show major divergence from last month's figure.
Top Trade Setups Today
EUR/USD – Double Top & Reversal Pattern
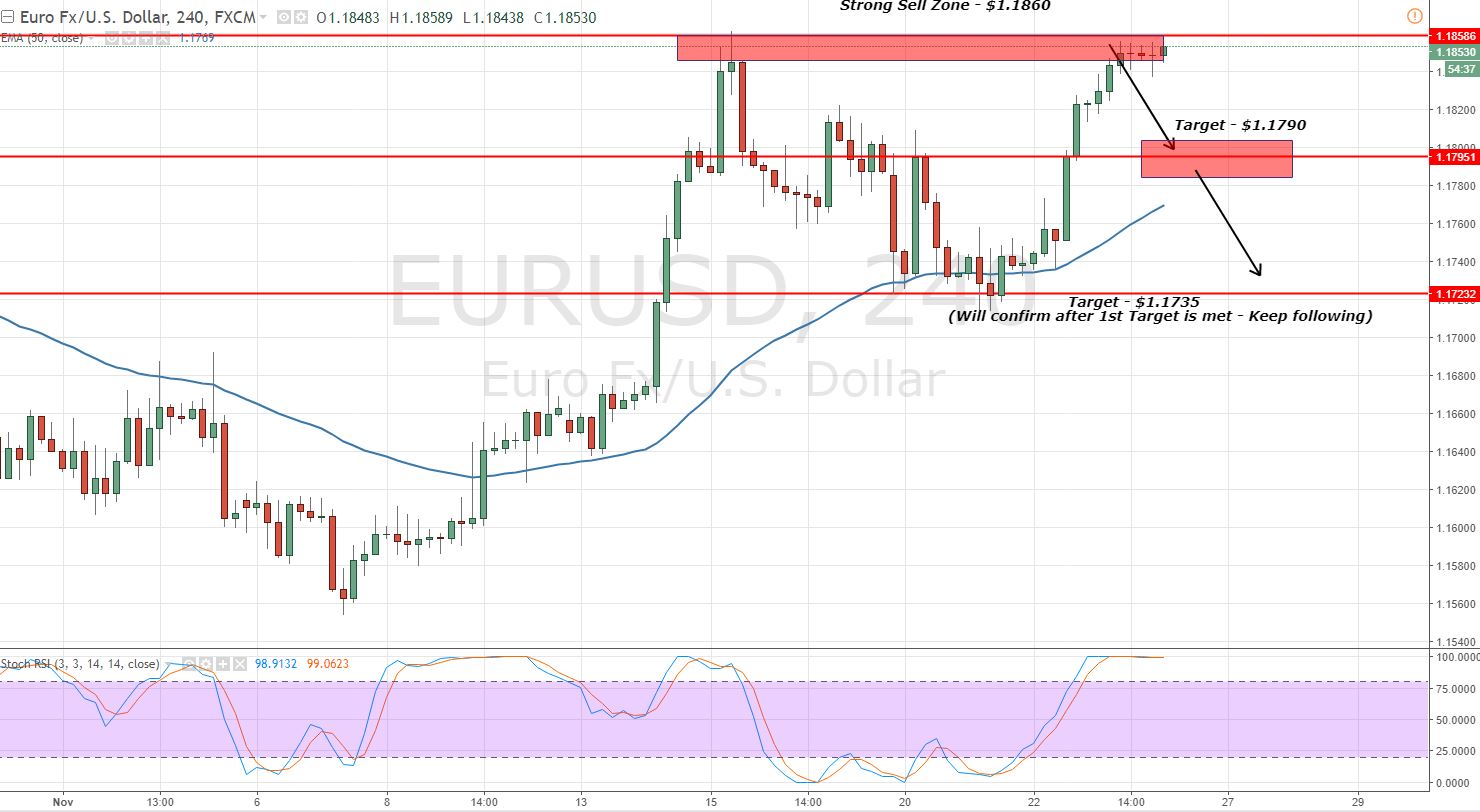
The EUR/USD has steadily reached a highly crucial trading level of $1.1860. On the 4 – hour chart, we can see the pair is testing $1.1860 resistance in order to make it a double top level.
 EUR/USD – 4 – Hour Chart – Double Top
At the same time, the Doji candles, just below $1.1860, are signifying the potential of reversal. I'm looking to stay in sell below this level but the market is too slow to yield us profits today. We need to be patient until Monday when the market action is expected to return.
EUR/USD – Key Trading Levels
Support Resistance
1.1822 1.1865
1.1796 1.1882
1.1779 1.1908
Key Trading Level: 1.1839
EUR/USD Trading Plan
I'm sticking with the plan of staying in sell below $1.1860 with a stop above $1.1890 and take profit at $1.1790 & $1.1735.
USD/JPY – Let's Catch Retracement
The weakness in the dollar initiated a sharp selling in the USD/JPY, thanks to FOMC meeting minutes. Now it's our time to cash in the opportunity.
 USD/JPY – 4- Hour Chart – Fibonacci Retracement
Looking at the 4 – hour chart of USD/JPY, the RSI and Stochastics are holding in an oversold zone. The 50 – periods EMA has is far away from the CMP, which signals that bulls may enter the market to buy a cheaper currency pair.
Applying a Fibonacci, the pair is likely to retrace back up to $111.450 & $111.700. Breakage above this level will lead it towards $111.950.
USD/JPY – Key Trading Levels
Support Resistance
111.06 111.37
110.9 111.52
110.75 111.68
Key Trading Level: 111.21
USD/JPY Trading Plan
The idea is to enter a buying position above $111.250 with a stop above $110.950 and take profit of $111.650. Good luck and have a lovely weekend!
- Check out our free forex signals
- Follow the top economic events on FX Leaders economic calendar
- Trade better, discover more Forex Trading Strategies
- Open a FREE Trading Account
 EUR/USD – 4 – Hour Chart – Double Top
 USD/JPY – 4- Hour Chart – Fibonacci Retracement