EUR/USD Reversing Down at the 100 SMA After A Good Bearish Chart Setup
The US Dollar had a tough week last week and the Euro took full advantage of it. EUR/USD gained more than 200 pips, but on Monday this week
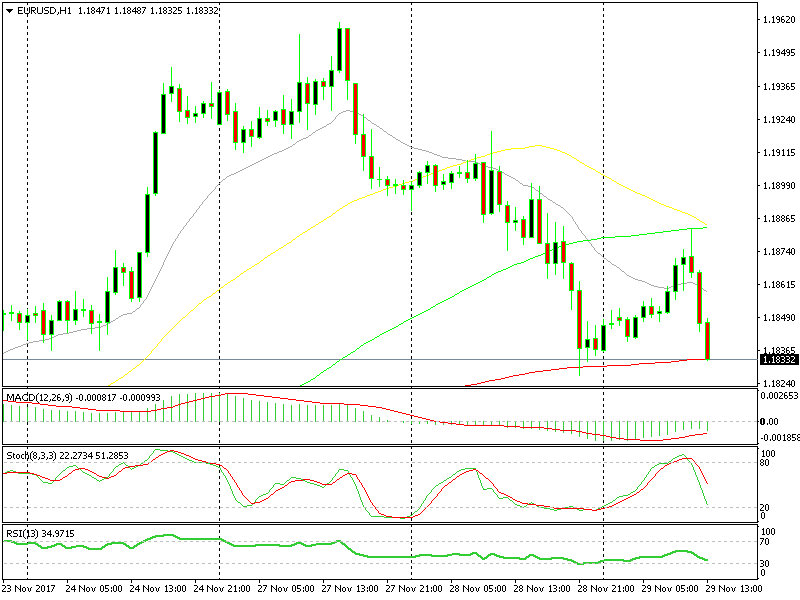
The US Dollar had a tough week last week and the Euro took full advantage of it. EUR/USD gained more than 200 pips, but on Monday this week this forex pair started reversing lower and now the chart setup seems to have turned bearish in almost all timeframes.
The H4 chart is oversold with the price still sliding lower. Although, I was looking at the hourly forex chart and noticed a couple of hours ago that there was a good selling opportunity. But, the price had already slipped 20 pips lower from the perfect selling spot, so I held back waiting for a better price a bit higher, closer to the 100 SMA.
We’re trading between two moving averages today
As you can see from the EUR/USD chart above, this pair retraced higher overnight after losing about 150 pips in the last two days. The retrace was over by the time the price reached the 100 SMA (green).
The stochastic indicator reached the top of the window, which means that the H1 chart was oversold. The idea is that when the chart becomes overbought on a downtrend, the retrace up should be over. Besides that, the 100 SMA was providing resistance up there, so a top formed for the day.
As I said, we didn’t take that trade, but that’s how I come up with trades. On trendy markets, I wait for a retrace; then when stochastic becomes overbought and a moving average provides resistance I try to sell, with a stop above the moving average or resistance level.
- Check out our free forex signals
- Follow the top economic events on FX Leaders economic calendar
- Trade better, discover more Forex Trading Strategies
- Open a FREE Trading Account