Can Crude Oil Stay Above 50- Periods EMA?
Good afternoon, folks. The market remained calm during the Asian and European sessions but our forex trading signal on Nikkei managed to ta
Good afternoon, folks. The market remained calm during the Asian and European sessions but our forex trading signal on Nikkei managed to take our share of it. We just opened a forex trading signal in Oil. Take a look…
Quick Technical Review
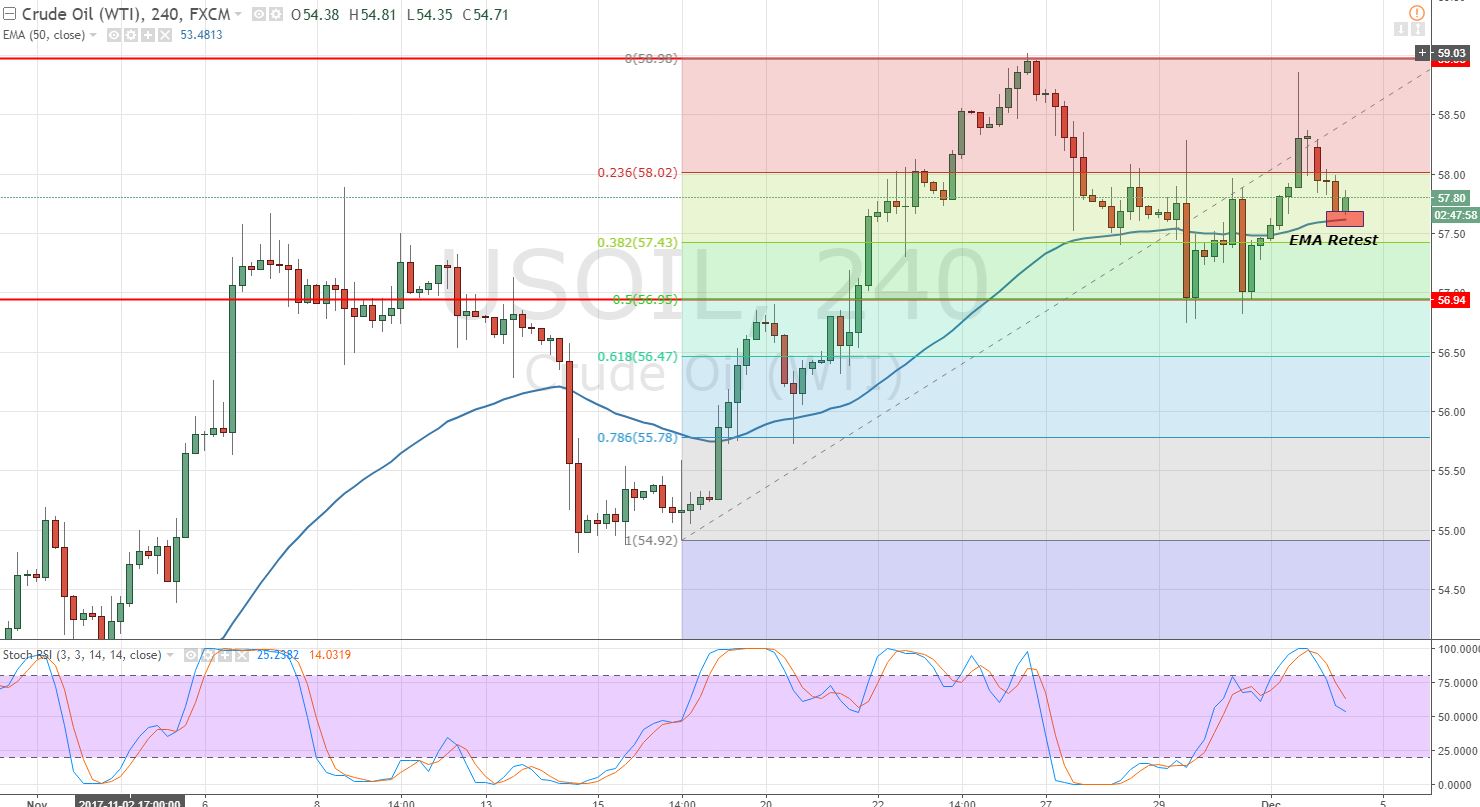
Technically, the Oil is trading in a bullish mode. Just look at the chart below, the Oil is trading above the 50- periods EMA. Remember, the Fibonacci trading levels we discussed in our earlier articles. Crude Oil has completed the 50% retracement at $56.94.
 Crude Oil – 4- Hour Chart
 Crude Oil – 4- Hour Chart
 At the moment, Oil is consolidating in a wide trading range of $57 – $59. But what I'm focusing on is the 50- periods EMA support at $57.70. That can be a point of reversal for Oil now. Secondly, the Stochastics and RSI aren't in the overbought zone now.
WTI Crude Oil – Trading Plan
We shared a trading signal to stay bullish above $57.60 with a stop below $56.58 and a take profit of $58.785. Good luck!
- Check out our free forex signals
- Follow the top economic events on FX Leaders economic calendar
- Trade better, discover more Forex Trading Strategies
- Open a FREE Trading Account